Your regression gate needs a power calculation
I deliberately broke my summariser's prompt, then failed to detect it two ways: with an LLM judge over a golden dataset, and with a judge-free deterministic assertion. Removing the judge changed nothing. Here is the calculation that would have told me first.
On this page
- What this is following on from
- The regression
- Attempt one: the judge over the golden dataset
- Attempt two: delete the judge
- What was actually wrong
- What the gate does catch
- The row that neither passed nor failed
- Where this sits against what is already written
- The suite I was about to recommend, which would not have worked
- What I now do
- The honest caveats
- The model that went away mid-experiment
- Series
Series Navigation
I deleted the anti-hallucination guardrail from my summariser’s system prompt on purpose, to see whether my eval would notice.
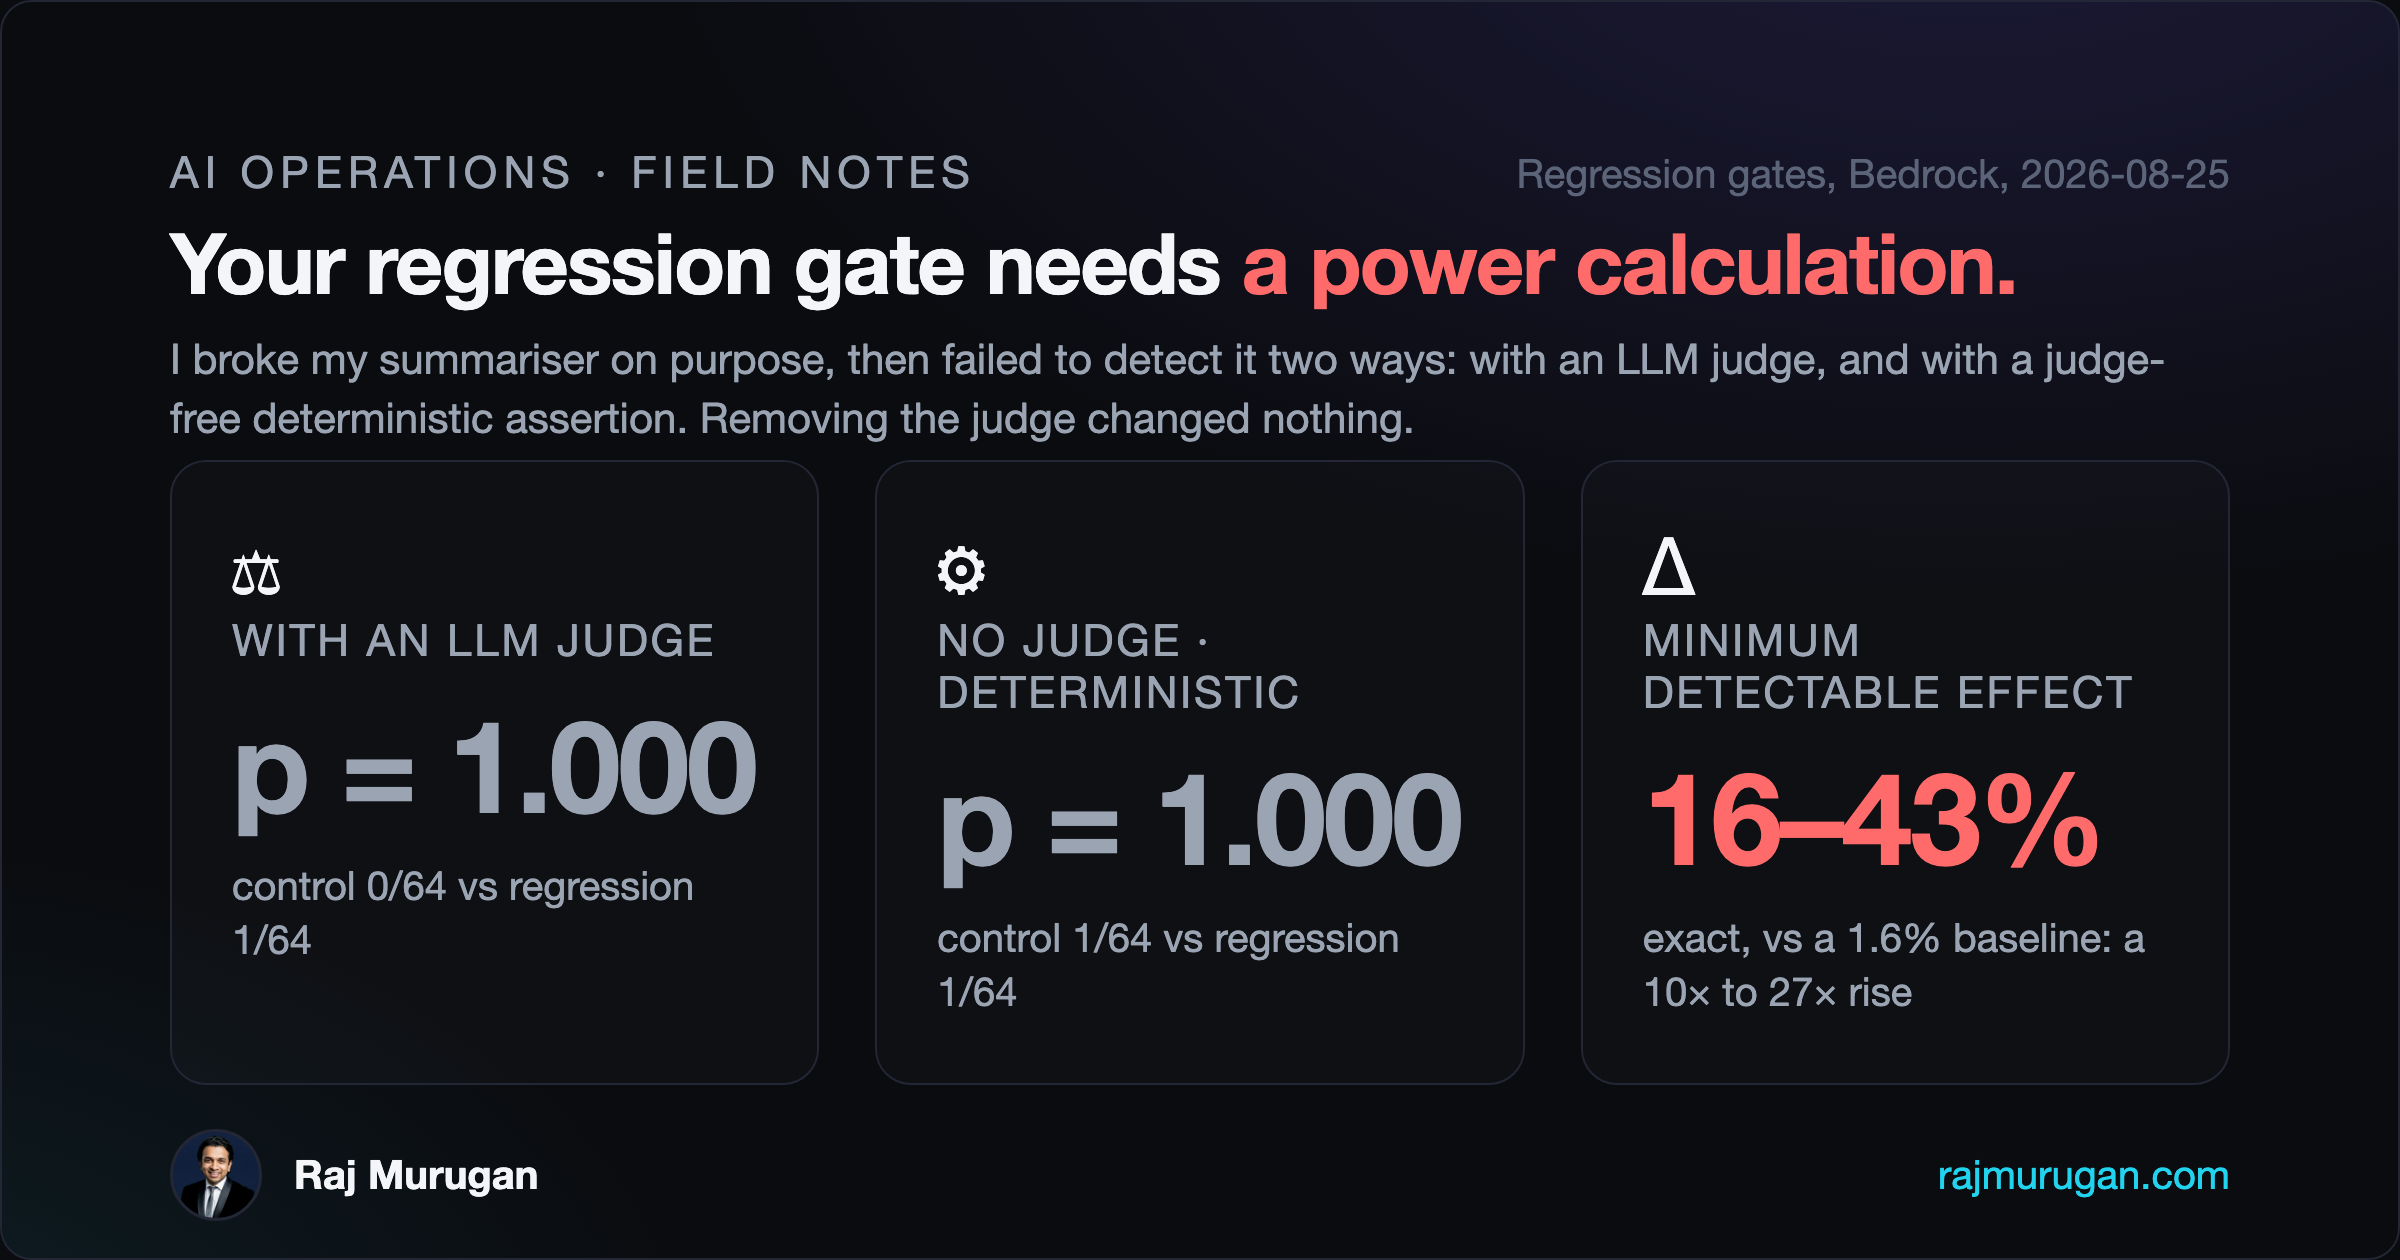
It did not. Then I removed the LLM judge from the eval entirely and replaced it with a deterministic string assertion, on the theory that the judge was the weak link. That did not notice either. Two measurement approaches, one with a model in the loop and one without, both returning the same answer: no detectable difference, Fisher exact p = 1.000.
The interesting part is not that the gate failed. It is that I had a confident, wrong explanation ready to publish, and the second experiment is the only reason I did not.
What this is following on from
Part 1 tested whether an LLM judge can be trusted at all. Five deliberately corrupted summaries, 5 out of 5 caught and correctly named. Four repeat gradings of an unmodified input, identical scores every time. The judge discriminates and it is stable.
A regression gate is a different job. It runs in CI, nobody injected an error, nobody knows what changed, and its whole purpose is to notice that quality dropped before your users do. I assumed that a judge which clears Part 1’s three rounds is fit for that job. This post is what happened when I checked.
The regression
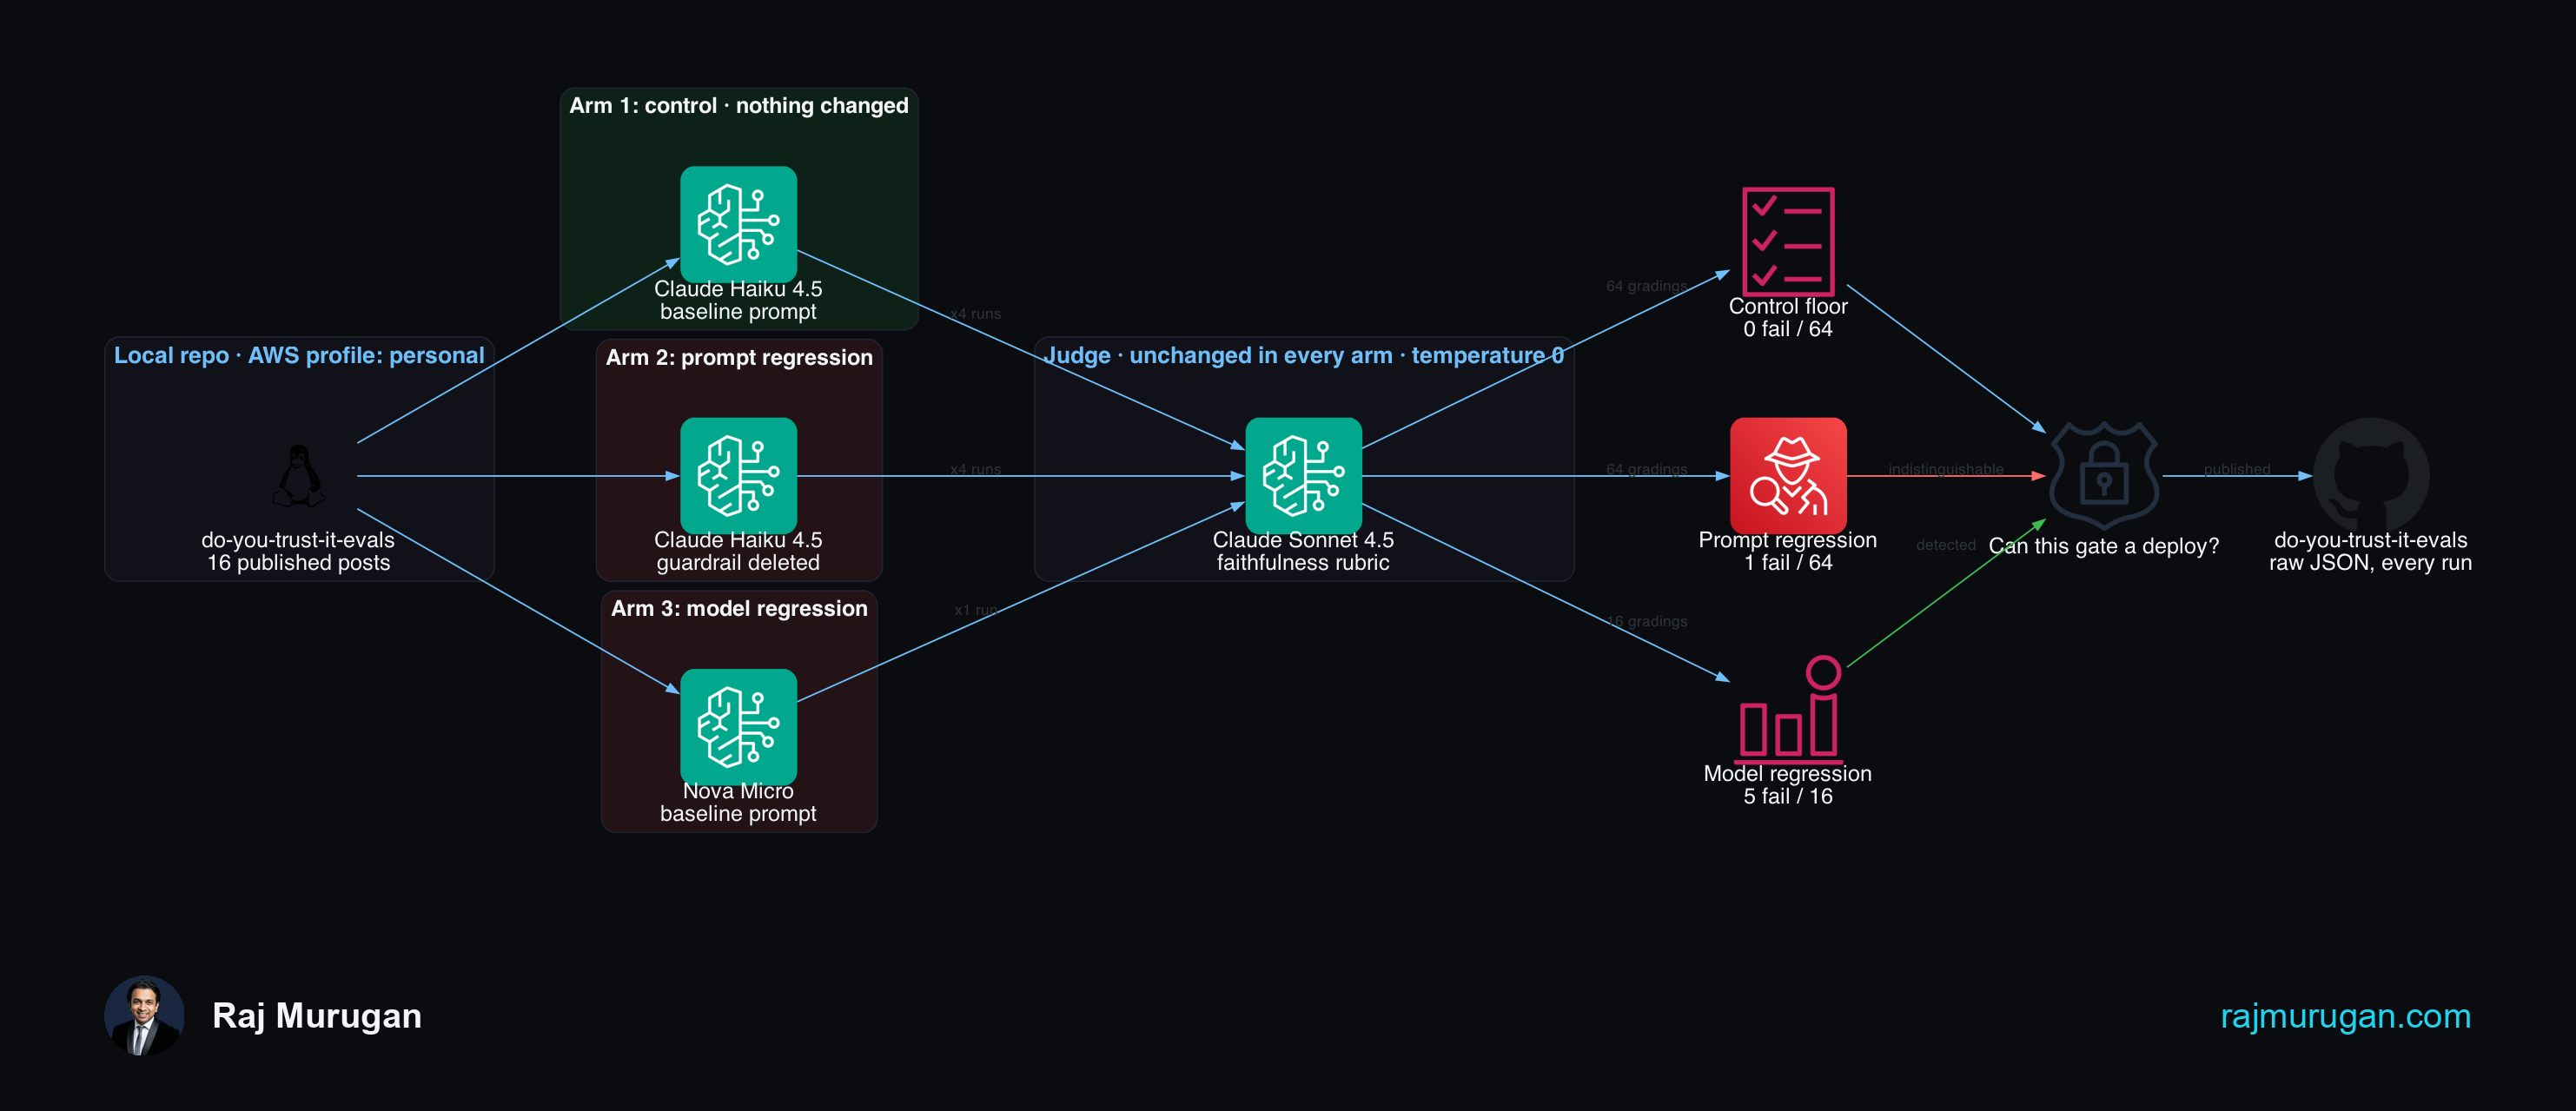
Sixteen published posts from this blog, summarised by Claude Haiku 4.5 on Bedrock, graded by Claude Sonnet 4.5 against a strict faithfulness rubric at temperature 0. The judge never changes anywhere in this experiment. It is the instrument.
The break is one variable: three sentences deleted from the summariser’s system prompt, the task sentence untouched.
# Baseline
SYSTEM_PROMPT = (
    "You summarize technical blog posts in 2-3 sentences for a reader deciding whether to "
    "click through. Base the summary ONLY on the text provided. Do not add claims, numbers, "
    "product names, or examples that are not explicitly present in the source text. If the "
    "post does not state a specific number or outcome, do not invent one."
)

# Regression: the guardrail is gone, the task is identical
DEGRADED_SYSTEM_PROMPT = (
    "You summarize technical blog posts in 2-3 sentences for a reader deciding whether to "
    "click through."
)
That is what a prompt looks like after somebody tidies it up, and it is the change a reviewer waves through.
Alongside it, two controls. A control arm runs the identical model and the identical prompt, byte for byte, changing nothing. The summariser runs at temperature 0.3, so the baseline is not deterministic and I need to know how much it moves on its own. And a positive control: the same prompt with a much weaker summariser, Amazon Nova Micro, which AWS describes as its “fastest text-only model, optimized for speed and low cost in tasks like summarization, translation, and classification”, at roughly a thirtieth of Haiku 4.5’s input price. Worth noting AWS names summarisation first, so this is not a model being used outside its stated purpose, it is a model built for speed and cost on short work being asked for faithfulness on long documents. That arm exists to show the gate detects anything at all.
Attempt one: the judge over the golden dataset
One run of each arm looked like a clean gradient.
| Arm | Verdict | Mean faithfulness | Items moved |
|---|---|---|---|
| Baseline (Part 1) | 16/16 PASS | 5.00 | reference |
| Control | 16/16 PASS | 5.00 | 0 |
| Prompt regression | 15/16 PASS | 4.94 | 1 |
| Model regression | 11/16 PASS | 4.19 | 7 |
Nothing changed, nothing moved. Subtle change, small movement. Blunt change, big movement. The gate works, just coarsely.
I nearly wrote that post. Part 1 had already taught me why not: its most interesting first-run finding did not survive a controlled re-run and was cut before publishing. One item moving, once, out of sixteen is the same shape. So I ran both arms three more times each.
| Arm | Failures per run | Total | Mean faithfulness per run |
|---|---|---|---|
| Control | 0, 0, 0, 0 | 0 / 64 | 5.00, 5.00, 5.00, 4.94 |
| Prompt regression | 1, 0, 0, 0 | 1 / 64 | 4.94, 5.00, 5.00, 5.00 |
Fisher exact on 0/64 against 1/64 gives p = 1.000. The gradient did not survive repetition. There was one event.
That one event is real, and worth looking at, because it is the only direct evidence in this whole post that the guardrail does anything. The judge failed a summary containing “caused real production issues”. That phrase is not in the source, which says the author “burned an afternoon”. The judge’s reasoning named it exactly:
The summary accurately captures the main structure and three gotchas, but ‘caused real production issues’ overstates the source, which mentions ‘burned an afternoon’ and a separate OIDC gotcha in the blog’s own pipeline, not that these three gotchas caused production issues.
A textbook scope-broadening hallucination, correctly caught and correctly explained, of exactly the category the deleted sentences existed to prevent. Once, in 64 gradings.
Attempt two: delete the judge
Here is the explanation I was ready to publish. Faithfulness was pinned at 5.00 on every baseline item, so the metric had no headroom. The verdict is a binary step function over a continuous quality change. The judge cannot see small drops.
It is a tidy story and it is testable, so I tested it. If the judge is the bottleneck, an eval with no judge in it should do better.
So the trap moves to the input, and the assertion becomes deterministic. Each source post already states things at low intensity (“burned an afternoon”). A guarded summariser is told not to escalate; an unguarded one is free to. I defined a vocabulary of escalations (“production outage”, “caused an outage”, “data loss”, “in every case”, “guaranteed”, “catastrophic”, and similar), then filtered it per post to the phrases verified absent from that post’s own source text, so a hit can only ever be something the model introduced. Then a substring check. No judge, no rubric, no scores, no ceiling.
One caveat worth stating rather than letting a reader find it: this vocabulary is not independent of the first experiment. It contains “production issues”, the phrase the judge flagged in attempt one. I built the second gate partly from what the first one saw, which makes this a weaker replication than two genuinely independent designs would be.
| Gate | Control | Prompt regression | Fisher exact |
|---|---|---|---|
| LLM judge over golden dataset | 0 / 64 | 1 / 64 | p = 1.000 |
| Deterministic assertion, no judge | 1 / 64 | 1 / 64 | p = 1.000 |
The control tripped on “critical failure”. The regression arm tripped on “production incident”. One each.
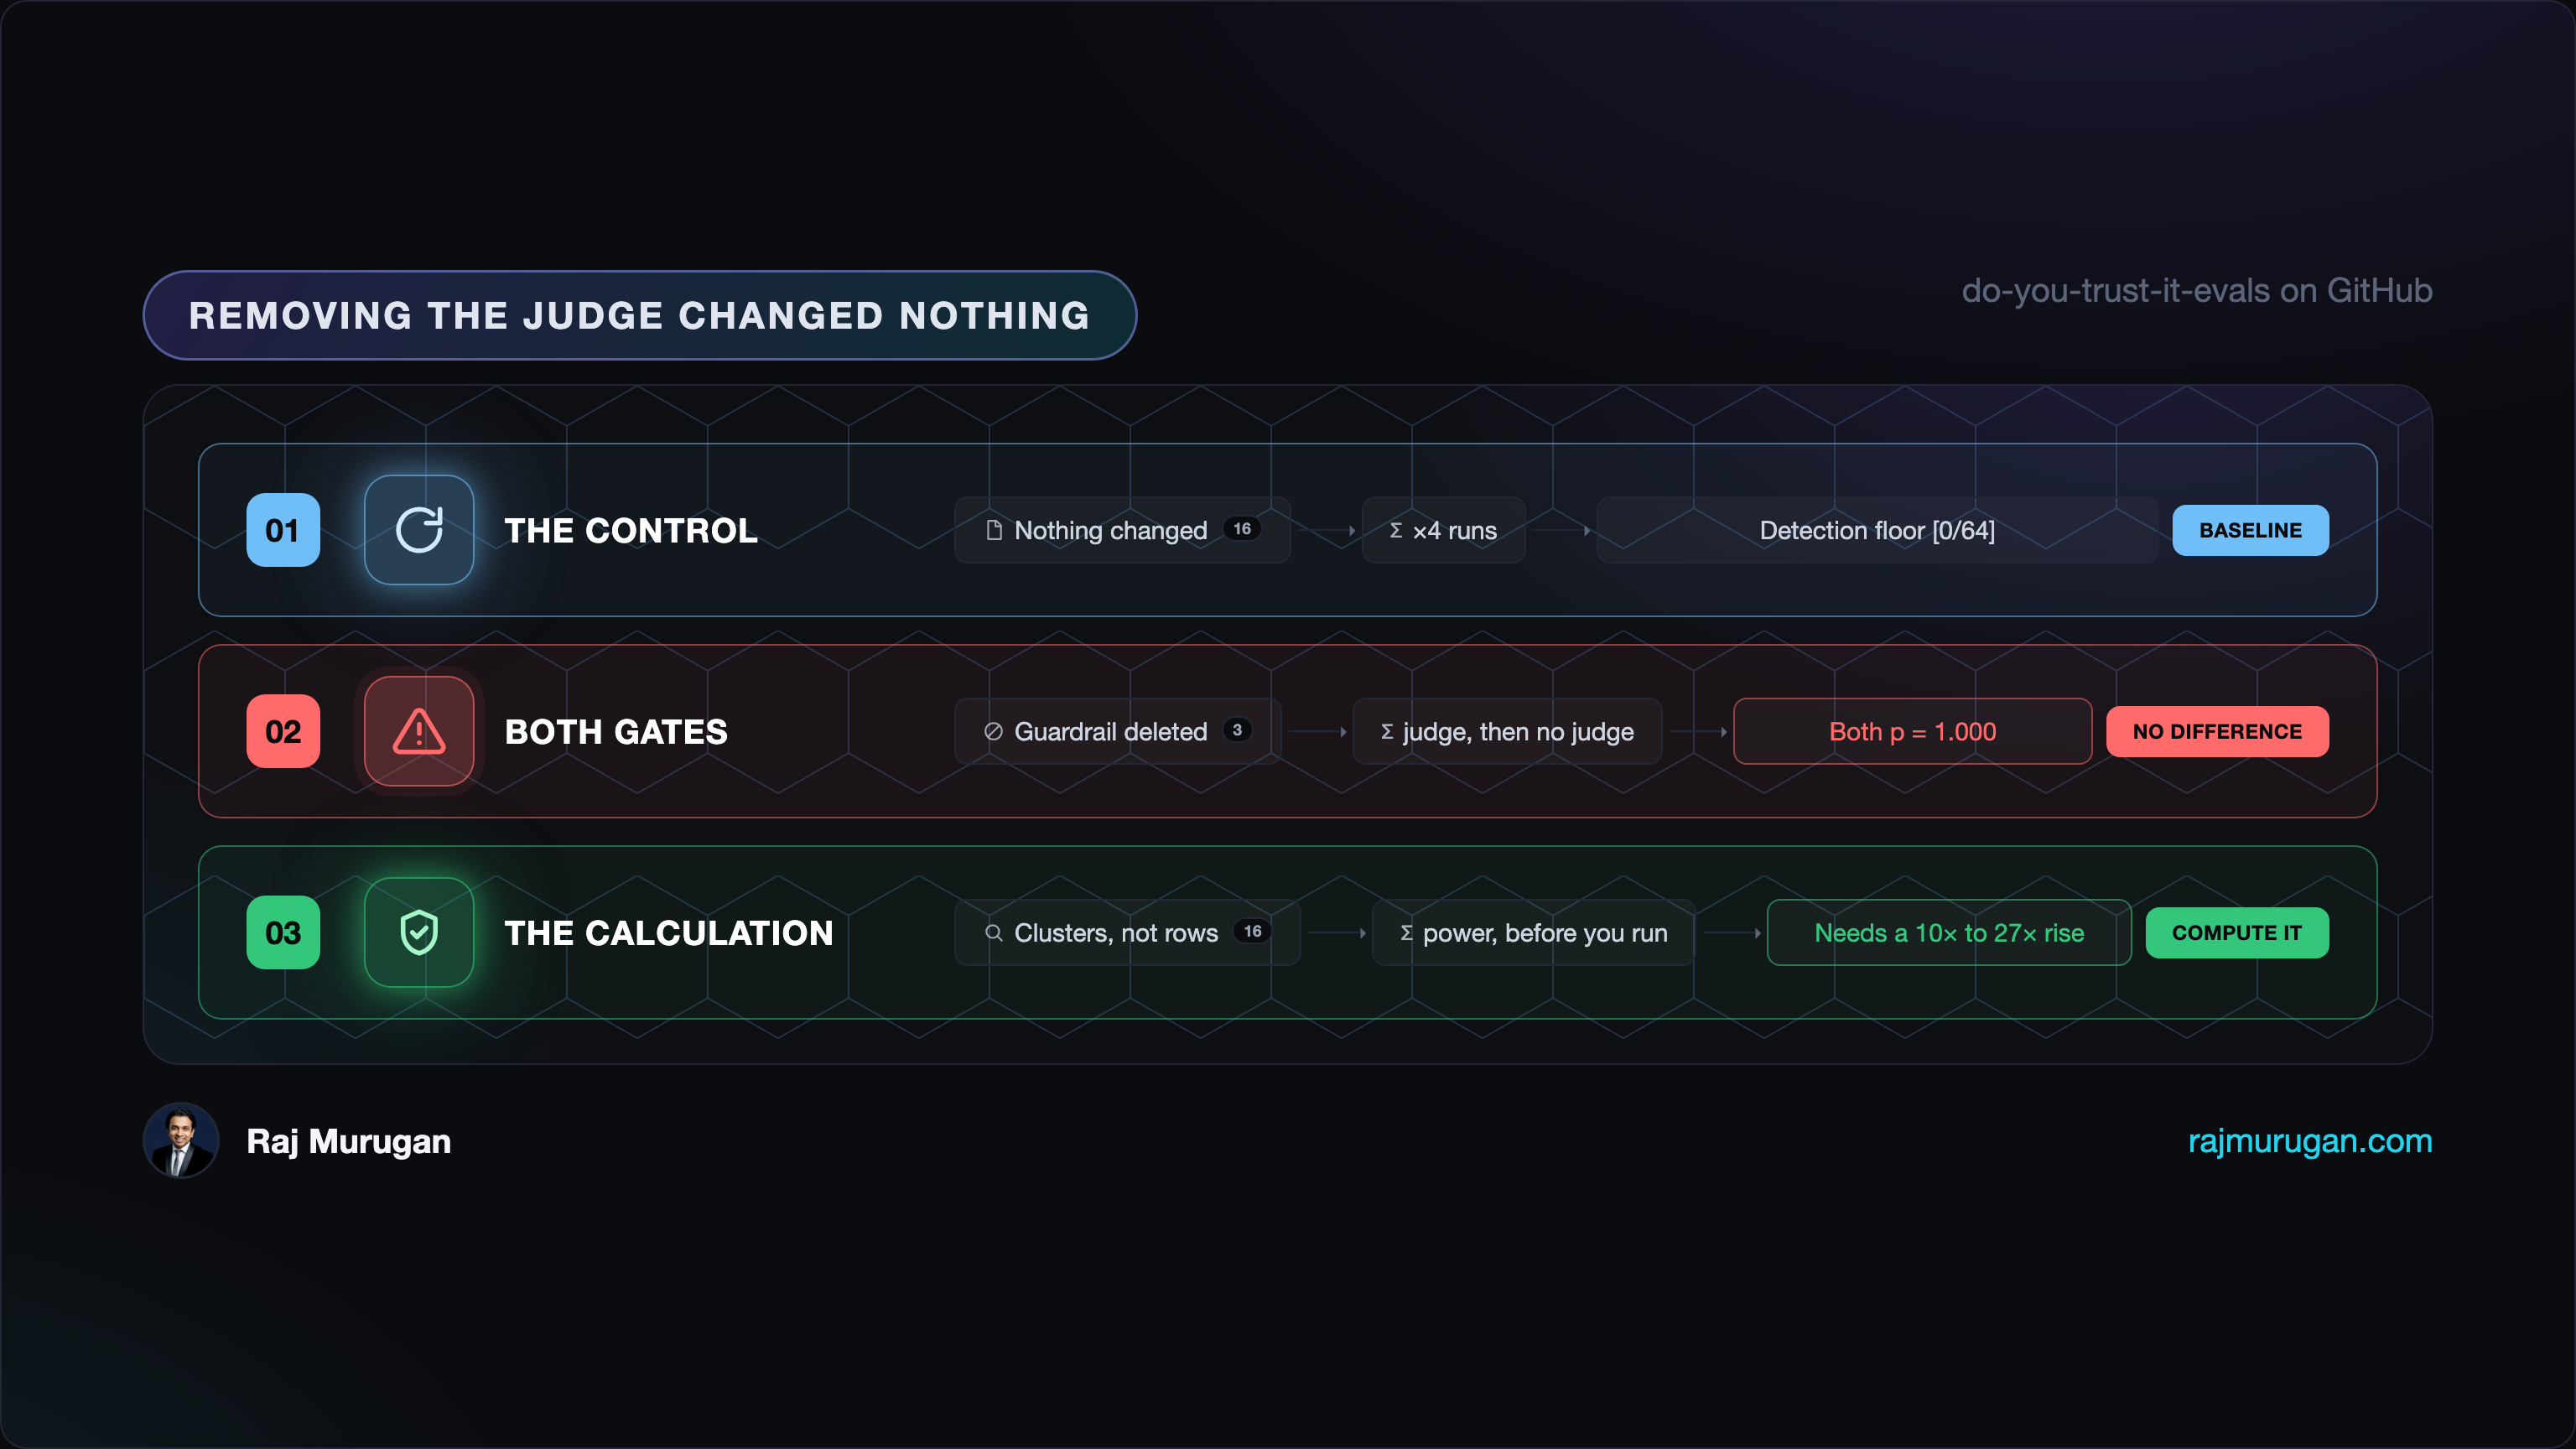
Removing the judge changed nothing. My explanation did not survive it.
What was actually wrong
Removing the judge changed nothing, so “the judge cannot see small drops” does not stand on its own as the explanation. That is weaker than saying the judge is exonerated, and the weaker version is what the data supports: both gates are blunt, and two blunt instruments returning the same null cannot tell you which one is blunt. What the next number shows is that the sample size alone is enough to explain both nulls, whatever the instruments were doing.
Both designs were asked to separate two rates that are, at everything measured here, roughly 1.6% each. So the real question is what size difference this design could have found at all.
With 64 gradings per arm at 80% power, the answer is 16.1%. The rate would have to rise more than tenfold before either gate reliably noticed.
That has to be computed exactly rather than with the usual two-proportion normal approximation, which wants around five expected events per arm. At a 1.6% baseline and n = 64 there is one expected event. Out of range, not borderline. Run it anyway and it returns 15.4%, which is roughly right by accident and wrong by method. The giveaway is that the standard approximations disagree with each other by nearly a factor of two at these rates, which is what happens when all of them are outside their range. The number above enumerates every outcome pair under two binomials and applies the same two-sided Fisher test used everywhere else here. It is twelve lines, in the repo.
It is worse than 64, too. Those 64 gradings are 4 repeats over the same 16 posts, so repeating them buys precision on each post’s score rather than more posts. Counting each post once, the same calculation gives 42.6%, a 27-fold rise. So the honest answer is a range: between about 16% and about 43%, depending on how correlated repeat gradings of one post are. Evan Miller is explicit in Adding Error Bars to Evals (arXiv 2411.00640) that this sits on a sliding scale, from “perfectly correlated (in which case each cluster acts as a single independent observation)” to perfectly uncorrelated. His second recommendation covers “[w]hen questions are drawn in related groups, computing clustered standard errors” and his third covers reducing variance by resampling answers, which is the one that actually bites here. His fifth is the one I skipped:
Using power analysis to determine whether an eval (or a random subsample) is capable of testing a hypothesis of interest
That is the calculation I did not do. It runs in under a second and it answers the question both experiments spent real money failing to answer. An eval that cannot resolve the effect you care about does not return “no regression”. It returns nothing, in a format that looks exactly like “no regression”.
What the gate does catch
The positive control lands hard. Swapping to Nova Micro moved seven items and dropped mean faithfulness from 5.00 to 4.19. The distortions are the interesting part, because they are not invented facts. On the prompt-caching post the summary reported “up to 99.9% hit ratios, proving the cost benefits of enabling caching”. The 99.9% is real: it is that post’s own headline measurement. What the weaker model added was “proving the cost benefits”, welding a cache hit ratio onto a billing claim the source measures separately at 55% and 78%. The judge caught the conflation, not the number.
So these gates are not broken. They are coarse, and the boundary is computable in advance rather than discoverable in production. Ten times the hallucination rate: caught. A change you would actually ship on a Tuesday: invisible.
The row that neither passed nor failed
Sixteen items in that arm. Eleven passed, four failed. That leaves one.
One grading came back as well-formed JSON with faithfulness: 4, completeness: 3, a populated hallucinations list and a sentence of correct reasoning. It had no verdict key. The judge answered every part of the question except the one the gate reads. By the rubric (PASS requires faithfulness 4 or higher and an empty hallucination list) a populated list makes it a FAIL, so the arm’s true count is five non-passing out of sixteen, which is what the charts show.
It happened once, in the sixteen gradings that arm got, and not in the 128 Haiku gradings. That arm was never re-run, so this is not evidence that it is rare: conditional on the arm where it appeared, one in sixteen is all I can say. Now consider a run of 15 PASS, 0 FAIL, and one of these:
assert passed == total                    # 15 != 16, red. Catches it.
assert failures == 0                      # 0 == 0, green. Misses it.
pass_rate = passed / (passed + failed)    # 15/15 = 100%, green. Misses it.
Only the first survives. The other two treat a malformed response as if the item did not exist. The third is the version people write, because computing a rate from the two buckets you have feels more careful than counting, and it is the one that silently drops the row from the denominator.
Where this sits against what is already written
“Your eval gate might be noisy” is not my discovery. The variance problem is named in places, and Miller’s paper is the rigorous treatment of it.
What I could not find is anyone publishing the control arm. The standard practitioner write-up, for instance Traceloop’s guide to prompt regression testing with LLM-as-a-judge in CI/CD, recommends running new versions against a curated dataset, scoring with a judge, and failing the build when quality declines. Reasonable on its face, and it says nothing about how far that score moves when nothing has changed, which is the number that decides whether any of it works.
So the delta is not the idea. It is the measurement: a re-run-with-nothing-changed arm, the same regression measured 64 times by two unrelated methods, the raw JSON published, and a power calculation attached to the result rather than left implicit.
The suite I was about to recommend, which would not have worked
I had a fix section written. It said: keep a suite of known-bad inputs, each asserting a specific failure the judge must still catch, and if somebody deletes the guardrail the fabricated-number case stops failing.
Then I read my own code. Part 1’s corruption suite hard-codes its five corrupted summaries as string literals and only ever calls the judge. The summariser is never invoked. Deleting the guardrail from SYSTEM_PROMPT cannot change that suite’s inputs, its outputs, or its 5 out of 5 result. It is a judge-regression test. It guards the instrument, not the thing being measured, and it has nothing to say about the regression this entire post is about.
I would have shipped that as the takeaway. It was caught by an independent review pass with no knowledge of how the post was built, which is the only reason it is in this section instead of the conclusion.
What I now do
- Compute the minimum detectable effect before running the eval, not after. If you cannot state what size regression your gate would catch, you do not have a gate, you have a ritual. Mine could catch a tenfold increase and nothing smaller, and one calculation would have told me that on day one.
- Run the control arm. Re-run with nothing changed and measure how far it moves on its own. Without that number, every difference you find is unattributed.
- Count clusters, not rows. Four repeats of sixteen items is sixteen independent units. Repeating a small dataset raises confidence in the mean, not the sample size.
- Assert on the count, never on a rate derived from buckets.
passed == totalcatches a malformed response.failures == 0andpassed / (passed + failed)both quietly drop it. - Check that your test exercises the thing you changed. A suite can be rigorous, pass cleanly, and be pointed at a different component entirely.
The honest caveats
The load-bearing limit is the one this whole post is about: I cannot tell you how much worse the guardrail deletion makes the summariser. I can show it produced at least one real hallucination, verified absent from its source. I cannot show it happens more often than with the guardrail in place, because neither design has the resolution to distinguish 1.6% from 1.6%. There is a reading of this data where the true post-deletion rate genuinely is about 1.6%, the gates are correctly reporting a tiny effect, and “underpowered” rather than “blind” is the right word. That reading is consistent with every number here, and the practical conclusion does not change: compute the effect you need to detect before you trust the answer.
Sixteen posts, one judge model, one rubric, one summariser family, four repeats per arm. I am not claiming a general result about LLM-as-judge regression detection. The mechanism is general enough to be worth checking in your setup; the numbers are mine.
The positive control is weaker evidence than the other two arms, deliberately. My intended swap was to an older model in the same family, which would have been a clean single variable. Nova Micro crosses model families, so tokenizer, training and instruction-following all move at once. It is there to show the gate detects something, not to attribute what.
Part 1’s runs were on 2026-08-18 and these on 2026-08-24: six days apart, same judge model, same rubric, same account, not the same sitting.
The model that went away mid-experiment
The within-family swap was blocked, for a reason worth stating accurately, because my first instinct was to write it up as “the provider retired a model out from under me with no warning” and that is not what happened.
Bedrock’s model lifecycle has three states: Active, Legacy, End-of-Life. Claude 3 Haiku moved to Legacy on 10 March 2026 with a published EOL of 10 September 2026, sixteen days after this post goes up. Six months of notice on a public page. No ambush.
What actually bit me is narrower. Access lapses on an inactivity timer: new customers cannot use a Legacy model at all, and existing customers “may lose access” after a period of not calling it. The exact period is worth flagging because the sources disagree. The documentation says access may be lost “after 15 days of inactivity”. The error Bedrock returned to me says 30.
ResourceNotFoundException: Access denied. This Model is marked by provider as
Legacy and you have not been actively using the model in the last 30 days.
Please upgrade to an active model on Amazon Bedrock
I am quoting both rather than picking one, because I do not know which governs and I did not test the boundary.
The documented model-access flow is to re-accept the agreement with aws bedrock list-foundation-model-agreement-offers and aws bedrock create-foundation-model-agreement, or through model access in the console. AWS documents those as the model-access steps; it does not connect them to Legacy inactivity specifically, and I did not test whether they recover a lapsed Legacy model. To check where you stand before any of this matters, aws bedrock get-foundation-model-availability --model-id <id> returns an agreementAvailability field. There is also a phase worth knowing about: since 10 June 2026 Claude 3 Haiku has been in public extended access, during which the docs say to expect higher, provider-set pricing. In this case that has not bitten. Bedrock’s published extended-access price table currently lists only Claude 3.5 Sonnet and 3.5 Sonnet v2, not Claude 3 Haiku.
So the operational lesson is not that providers retire models without warning. It is that a benchmark baseline you only run occasionally is exactly the workload an inactivity timer catches, that reactivating may cost more than it did, and that after the EOL date it stops being recoverable at all. Pin the recorded outputs rather than assuming you can regenerate them.
All five rounds, every script, and the raw JSON for every run and every arm are in the repo: github.com/rajmurugan01/do-you-trust-it-evals.
Series
This is Part 2 of Evals for Production AI, a series on how you actually know an AI system is good once it’s live, not according to the dashboard. Part 1 asked what it takes to trust an LLM judge’s score. This one pointed that trusted judge at the job most teams want it for, and found the instrument was not what decided the answer.
If you are wiring an eval into a deploy gate and want a second pair of eyes on where its detection floor actually sits, happy to compare notes. Find me on LinkedIn or via rajmurugan.com.
Next in Evals for Production AI: an offline eval can only ever test the inputs you thought to write down. What live production signals catch that a golden dataset structurally cannot, and how to spot a quality drop in traffic you never anticipated.
Related reading
The ML you need to operate LLMs, not train them
You do not need to train a transformer to run one well. What tokens, context budget and sampling knobs actually mean, verified against the current Bedrock Converse API, including a temperature/top_p gotcha that silently breaks on newer Claude models.
Introducing the AI Architect Roadmap
Eight rungs mapping what shipping production Agentic AI on AWS actually takes, marked honestly as covered, strong, flagship or gap rather than filled in to look finished.
You probably don't need to fine-tune
A post framed fine-tuning as a 2026 interview trap. Here is the AWS version: the ladder before you touch weights, the four job types and three serving paths Bedrock forks 'fine-tune' into, and what each one costs, priced today.
Newsletter
A new AWS and AI engineering write-up every Tuesday, directly to your inbox.
Also published on dev.to.
Comments
- Loading comments…