Your quality alert needs 32 samples
Part 3 left me a label-free signal that responds to a real regression. It does not come with a threshold. Here is where the line actually goes, what a false page costs, and why the reflex answer computes to a negative number.
On this page
Series Navigation
I finished Part 3 with a signal I could compute on live traffic with no answer key: trigram grounding, the fraction of a summary’s word-trigrams that appear in its source. It responds to a real regression. I wrote that it was a lead worth replicating, not a result, and I stand by that.
Then I tried to alert on it, and found the part nobody writes down. A continuous signal does not come with a threshold. You have to derive one, and deriving it tells you something uncomfortable about how much traffic you need before an alert means anything.
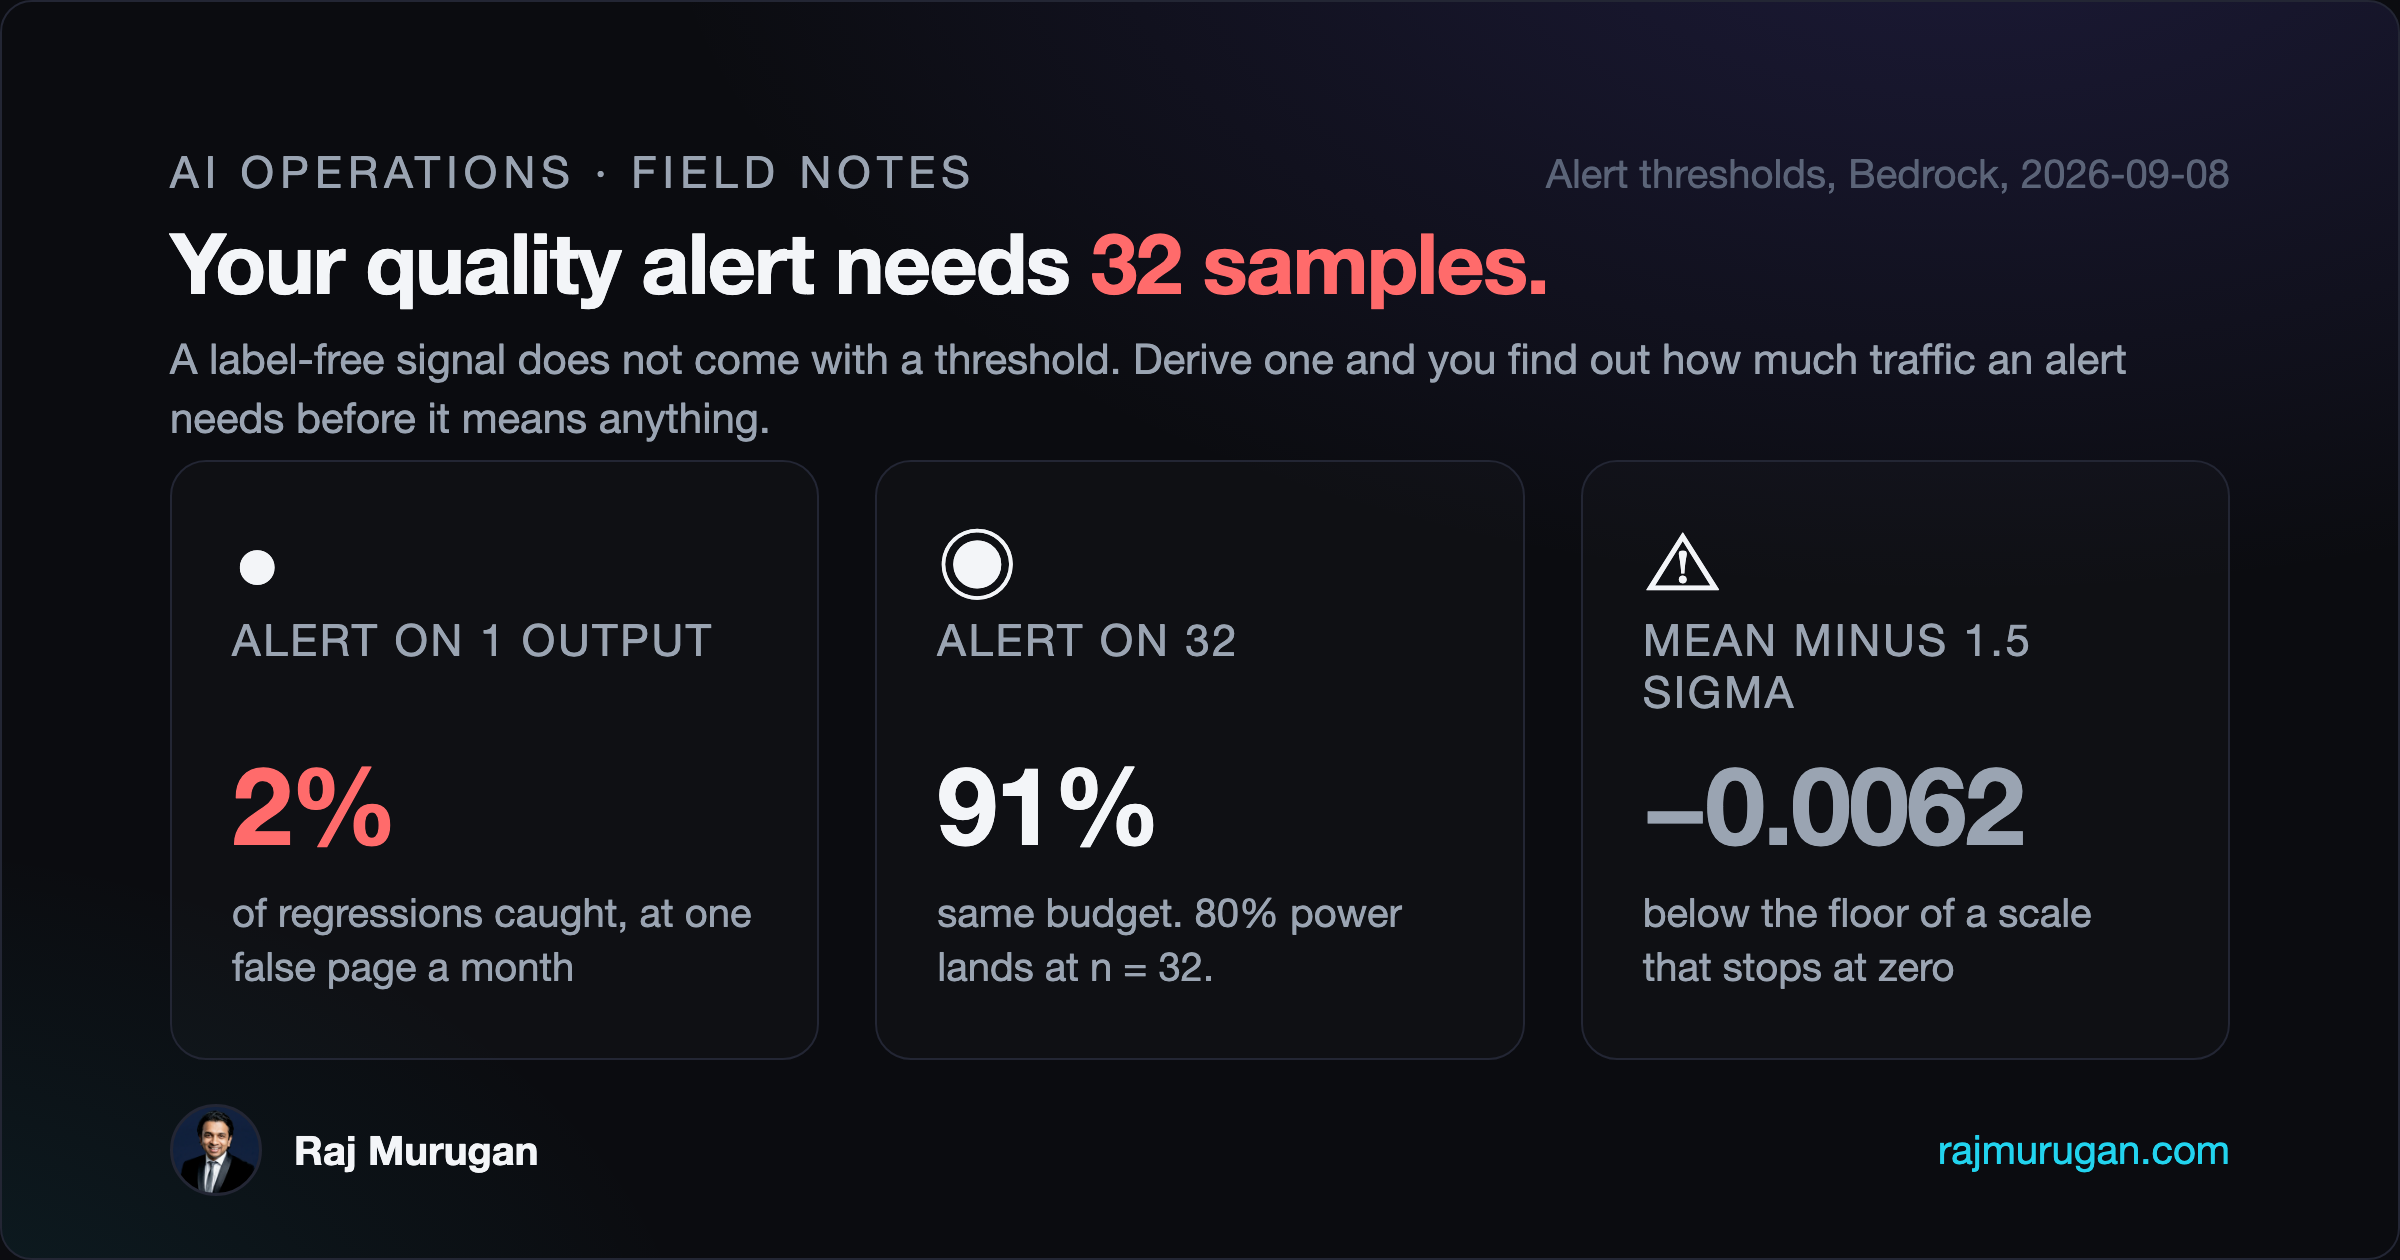
For a regression that drops the signal by a third, a single output catches 2% of the time. You need a window of 32 before you can page anyone.
The reflex answer, and why it is wrong here
Ask anyone where to put a threshold on a metric and you will get some version of “a couple of standard deviations below the mean”. It is the right instinct and it does not survive contact with this signal.
Here is the control arm from Part 3, 64 summaries generated with the guardrail intact, at the 2000-character tier, one of the two truncated tiers where the signal separates the arms:
| mean | 0.0830 |
| median | 0.0746 |
| standard deviation | 0.0594 |
| minimum | 0.0000 |
| p05 | 0.0167 |
That distribution is right-skewed with a hard floor at zero, and one perfectly healthy output scores exactly zero. Now apply the reflex:
| Threshold | Value | Pages on | Catches |
|---|---|---|---|
| mean − 1.0σ | +0.0235 | 14% of normal outputs | 20% |
| mean − 1.5σ | −0.0062 | 0% | 0% |
| mean − 2.0σ | −0.0359 | 0% | 0% |
At 1.5 sigma the threshold is a negative number, on a scale that cannot go below zero. It will never fire, on anything, ever. An alert that cannot fire looks exactly like an alert that is working.
The 1.0 sigma line is worse in a way that is easier to miss: it pages you on 14 out of every 100 normal outputs to catch 20% of real ones. Healthy outputs are essentially all of your traffic, so that is a pager firing on ordinary work almost every time it fires at all.
Deriving the line properly
The fix is to stop assuming a shape and use the one you measured. Resample the observed control distribution, build the null distribution of the window mean at size n, and put the threshold at whatever quantile matches your false-page budget. Then resample the regression arm and see how often it lands below that line.
Two budgets, because they are the two people actually argue about: one false page a month (roughly 3% of daily checks) and one a quarter (1%).
| Window size | Catches, 1 page/month | Catches, 1 page/quarter |
|---|---|---|
| 1 output | 2% | 0% |
| 4 | 11% | 3% |
| 8 | 29% | 13% |
| 16 | 58% | 36% |
| 24 | 79% | 58% |
| 32 | 91% | 78% |
| 48 | 99% | 94% |
| 64 | 100% | 99% |
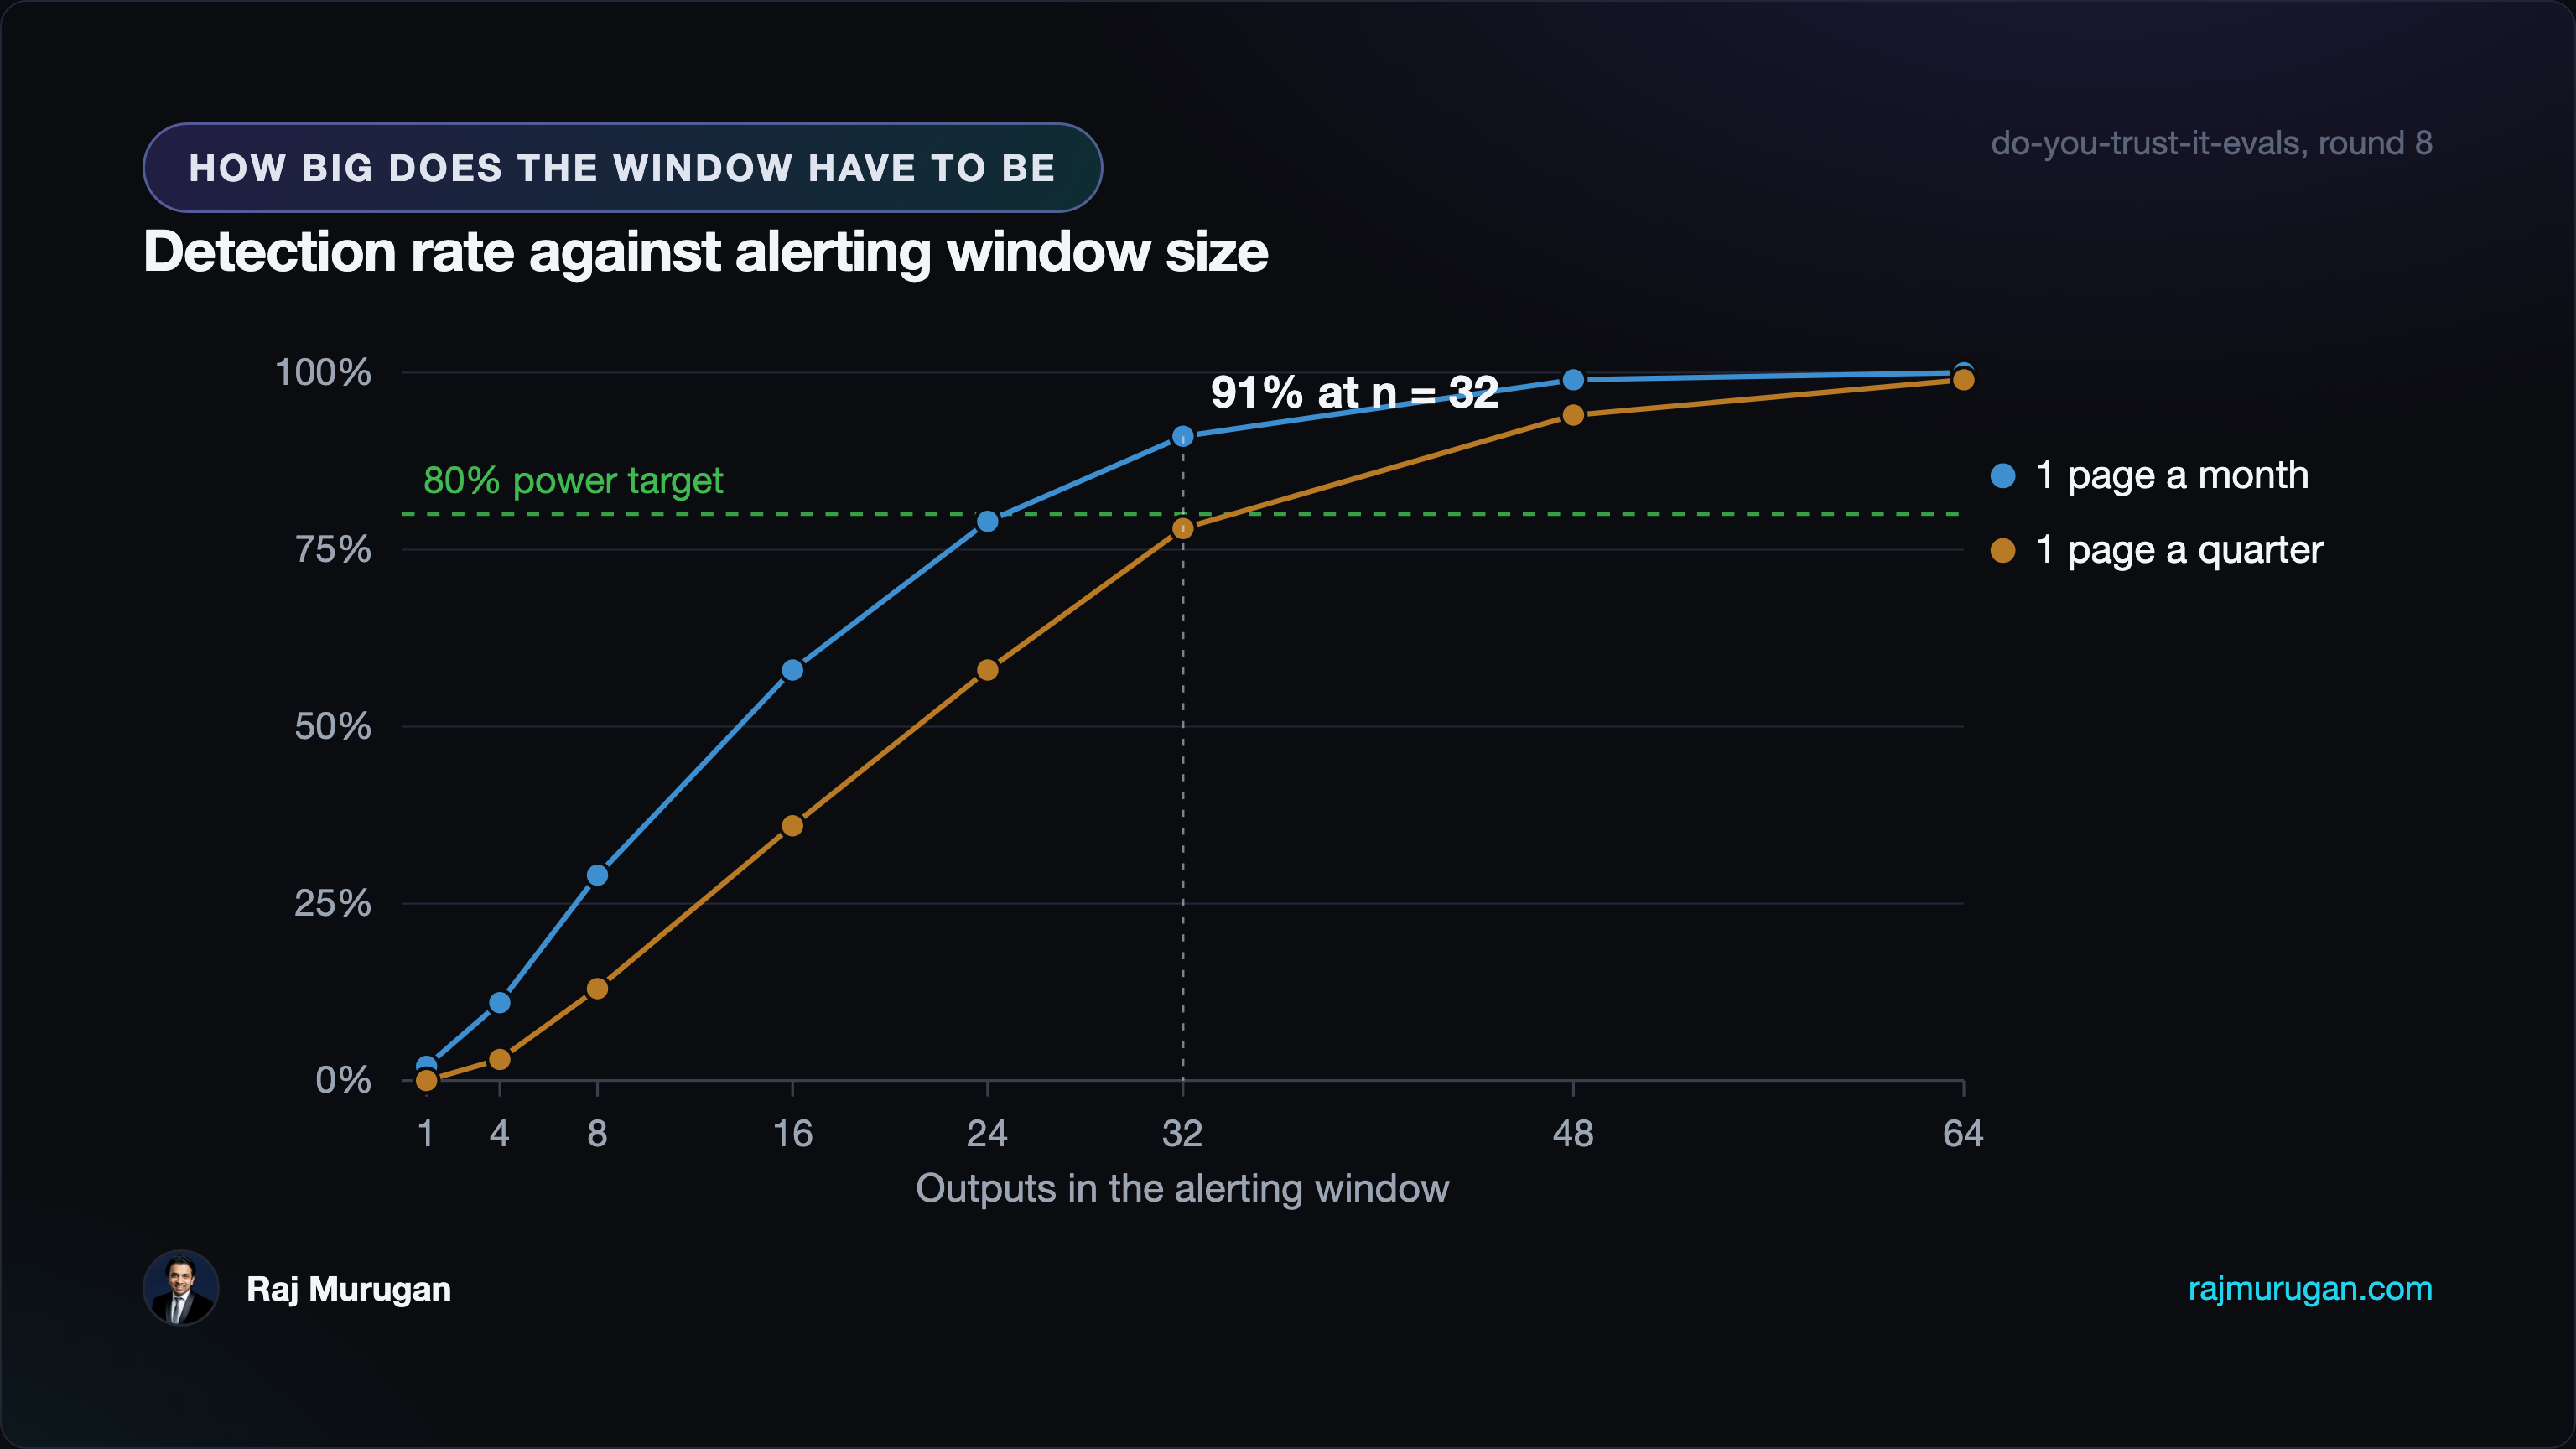
On this grid the monthly budget clears 80% at n = 32, and the quarterly one at n = 48. A finer sweep puts the actual monthly crossing nearer n = 24, which sits within simulation noise of the line itself. I would still build at 32: 24 is exactly on 80% and nobody designs an alert to sit on its own threshold.
Read the first row again, because it is the one that changes what you build. A single output, thresholded at a budget you could actually live with, catches one regression in fifty. Not a weak signal. Functionally no signal.
What that means if you are wiring this up
The instinct with a per-output score is to check it per output. Every eval harness I have seen encourages that: score the row, compare to threshold, flag the row. It is the wrong unit for this signal, and the arithmetic says so before you write any code.
- Alert on a window, not a row. The unit is an aggregate over n outputs, and n is a number you compute rather than pick.
- Work out what n means in your traffic. 32 outputs is a rounding error for a high-volume summariser and half a week for a low-volume internal tool. If it is half a week, you have not built a quality alert, you have built a weekly report, and you should call it that.
- Choose the false-page budget before the threshold. The budget is a product decision about how much trust you can spend. The threshold is arithmetic that follows from it. Doing it in the other order is how you end up at 14% of normal outputs.
- Calibrate the threshold on several hundred controls, not sixty-four. The threshold is an estimate too, and mine is built from 64 outputs. Simulate the real thing (draw m controls, set the line, apply it to fresh windows) and a nominal 3% budget calibrated on 64 comes back at 6.3% on average and 16.8% at the unlucky end. That is two to five times the pages you signed up for. At m = 512 it settles to 3.4%. Budget the control data before you budget the pages.
- The budget is per check, and I have quoted it at one check a day. 3% of daily checks is about one page a month. If you evaluate every window as it closes, multiply by how often that happens: a high-volume summariser running 300 windows a day at 3% is nine pages a day, not one a month. And rolling windows make consecutive checks correlated, which breaks the conversion altogether.
- Use quantiles of the observed distribution, not mean and sigma. Bounded, skewed metrics are the normal case in eval work, not the exception, and sigma-based lines on them are how you get a threshold below the floor of the scale.
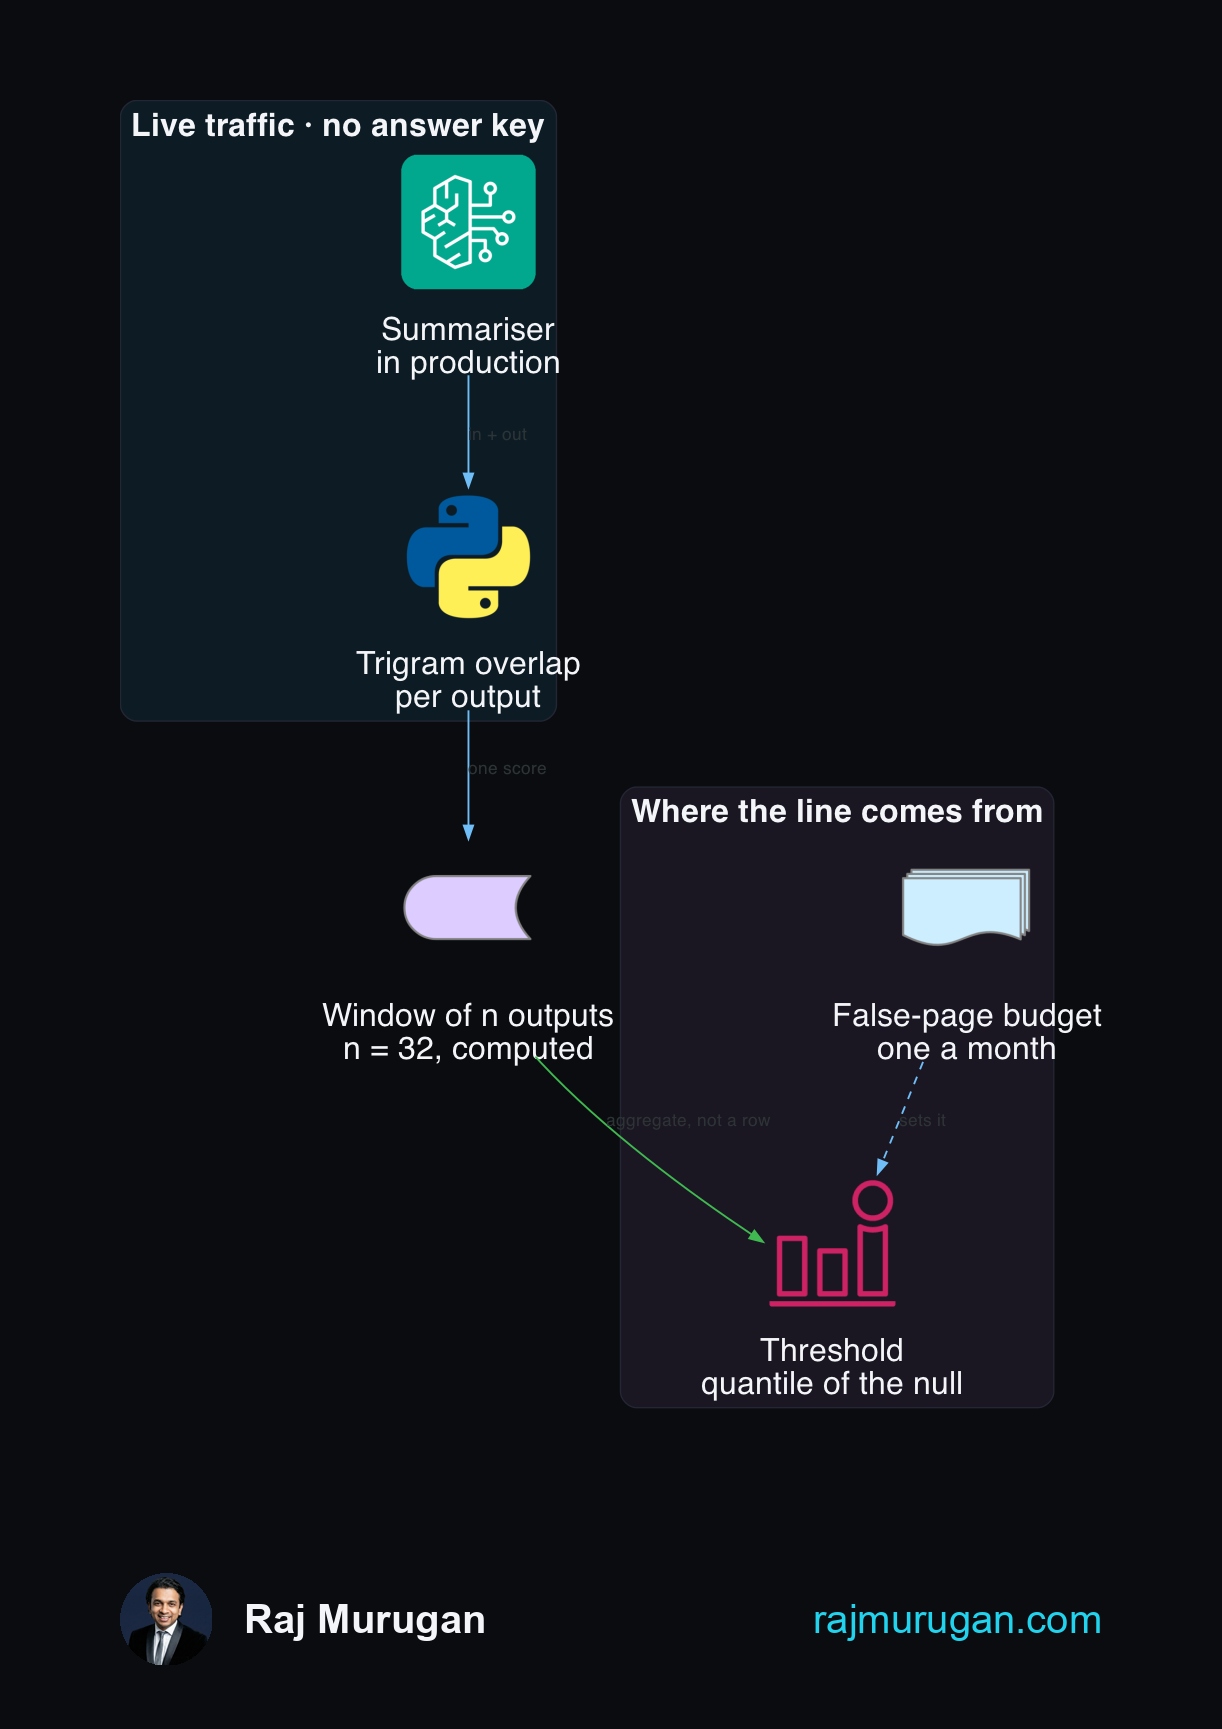
The threshold does not sit on the model output. It sits on an aggregate of them, and the size of that aggregate is the number this post is about.
The honest caveats
The effect being detected here is large. A 33.5% drop in the signal, from a deliberately deleted guardrail. Smaller regressions need bigger windows, and the table above is the optimistic end.
This is the truncated-input regime, and that is load-bearing. Everything above is the 2000-character tier. At 12000 characters, which is normal full-context operation, the same deleted guardrail moves the signal only 12.8% instead of 33.5%, and the window arithmetic changes with it: n = 32 gives 31% power, n = 64 gives 49%, and 80% needs more than 128. So if your inputs are not already thin, the honest answer is that this signal needs a much larger window than the number in the title, or a different signal.
One signal, one corpus, one summariser family. Sixteen posts written by one person, graded by one rubric. The n = 32 is mine. The method transfers; the number does not.
This assumes your window is stationary. I resampled a control arm collected in one sitting, so it carries no daily or weekly cycle. Real traffic has both, and a window that spans a Monday and a Sunday has variance my numbers do not include. That is not something a larger n fixes: with a fixed threshold and a drifting baseline the false-page rate drifts too. It needs re-baselining on a trailing control window.
And it is still built on a signal that did not survive correction. Part 3 was clear that trigram grounding is a lead, not a result: raw p = 0.020, Bonferroni 0.120. This post derives a threshold for it anyway, which is the right thing to do with a lead you intend to test, and the wrong thing to treat as settled. If the signal does not replicate in your setup, the threshold arithmetic is still the transferable part.
Every round, every script, and the raw JSON: github.com/rajmurugan01/do-you-trust-it-evals.
Series
This is Part 4 of Evals for Production AI, on how you actually know an AI system is good once it is live. Part 1 asked what it takes to trust an LLM judge. Part 2 pointed that judge at a deploy gate and watched it go blind. Part 3 found the blind spot was in the dataset, and left a label-free signal worth replicating. This one works out where its line goes.
If you are running a quality alert on an LLM output score, I would genuinely like to know what window size you landed on and how you chose it. Find me on LinkedIn or via rajmurugan.com.
Related reading
Field Notes: Three things I learned diagnosing a production Bedrock workload
Three findings from a real customer engagement on AWS Bedrock: what a load test was actually doing, why p95 latency was 45 seconds, and the prompt-caching default that costs every team money. Plus the three CloudWatch metrics that catch all three.
Field Notes: The AgentCore Memory write that returns success and reads back empty
AgentCore long-term memory has a read-after-write gotcha the docs skip: a direct BatchCreateMemoryRecords write returns 201 and stays unsearchable for 15 to 30 seconds. Measured, with the two-tier model that explains it.
Every dashboard was green while the agent burned six figures a year
The most expensive AI agent failures don't throw an error, they hide. One ran at a six-figure-a-year rate for days while every dashboard stayed green, because the signals that catch it are the ones nobody watches. The two instruments you are missing.
Newsletter
A new AWS and AI engineering write-up every Tuesday, directly to your inbox.
Also published on dev.to.
Comments
- Loading comments…