Field Notes: Three things I learned diagnosing a production Bedrock workload
Series Navigation
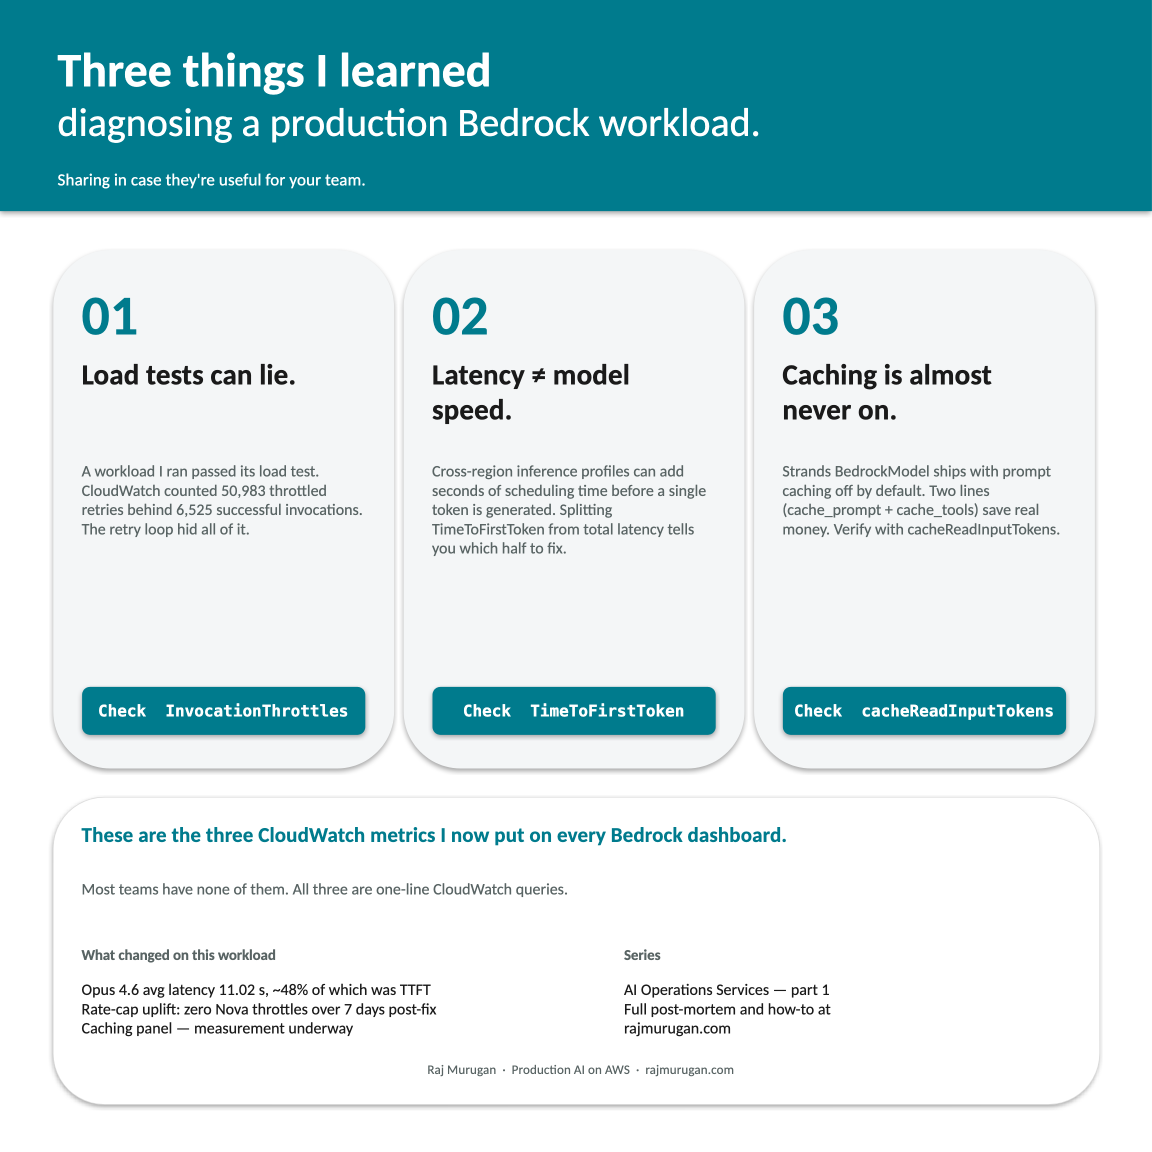
I spent a lot of time this month diagnosing a customer’s production AI workload on AWS Bedrock. Strands agent, AgentCore Runtime, the usual stack. Real users at the other end.
By the time the work was done, three things had surprised me enough to write them down. None of them is a brand-new discovery — they’re all visible in CloudWatch if you know which metrics to pull together — but the combination of which metrics weren’t on the dashboard and what the numbers actually said is the kind of thing I’d want a peer to tell me before I shipped the next one.
So I’m sharing them in case they’re useful for your team. Three things I learned, and the three CloudWatch metrics that now go on every Bedrock dashboard I touch.
By the numbers
The headline before the lessons that explain how we got there.
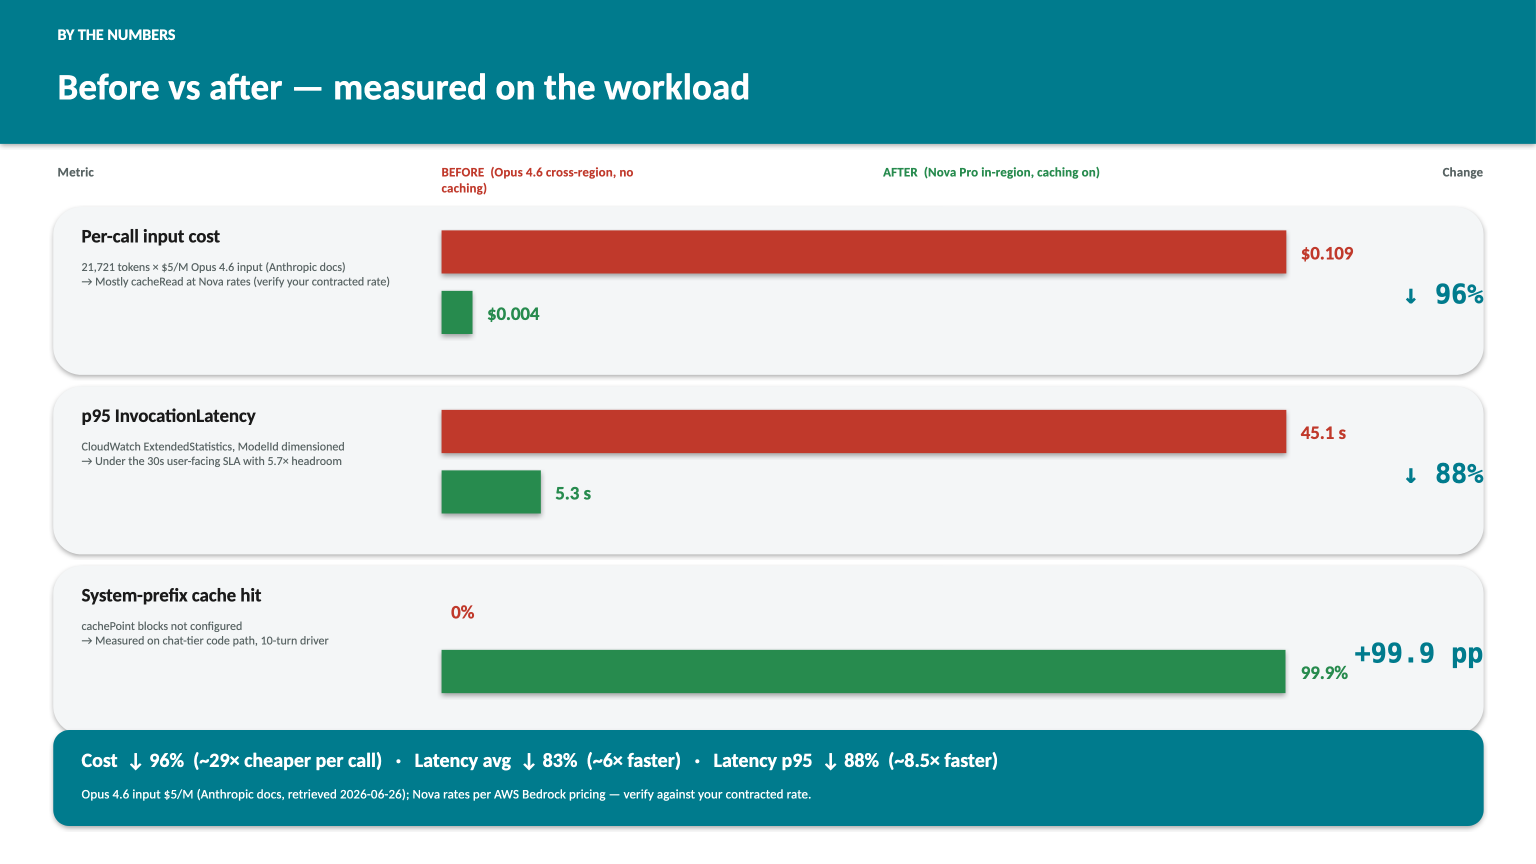
The 29× and 6×/8.5× are the combined effect of two shipped changes: a model + region swap (primary inference moved from Anthropic Opus 4.6 on a cross-region inference profile to Amazon Nova Pro in-region) and prompt caching turned on for the system prefix. The latency jump comes mostly from the swap. The cost jump comes from both: Nova’s per-token input rate is well under Opus 4.6’s, and the 99.9% hit rate on the system prefix means most of each call is billed at cacheRead price rather than full input. The two shipped together, but they’re independent — the lessons below explain how each one was diagnosed, sized, and verified. The dollar figures use Anthropic’s published $5/M Opus 4.6 input rate and AWS Bedrock’s published Nova rates; replace with your contracted rate to compute your own delta.
Lesson 1 — Load tests can lie
I ran a load test against the workload. By the usual pass-fail metrics it looked clean. Response times within the SLA. No 5xx errors at the BFF. No alarms tripped. The team’s Slack channel had the green tick reaction.
Then I went one layer below the BFF — counting ThrottlingException entries in the agent’s CloudWatch log group for the same hour, broken out per model. The numbers were not green.
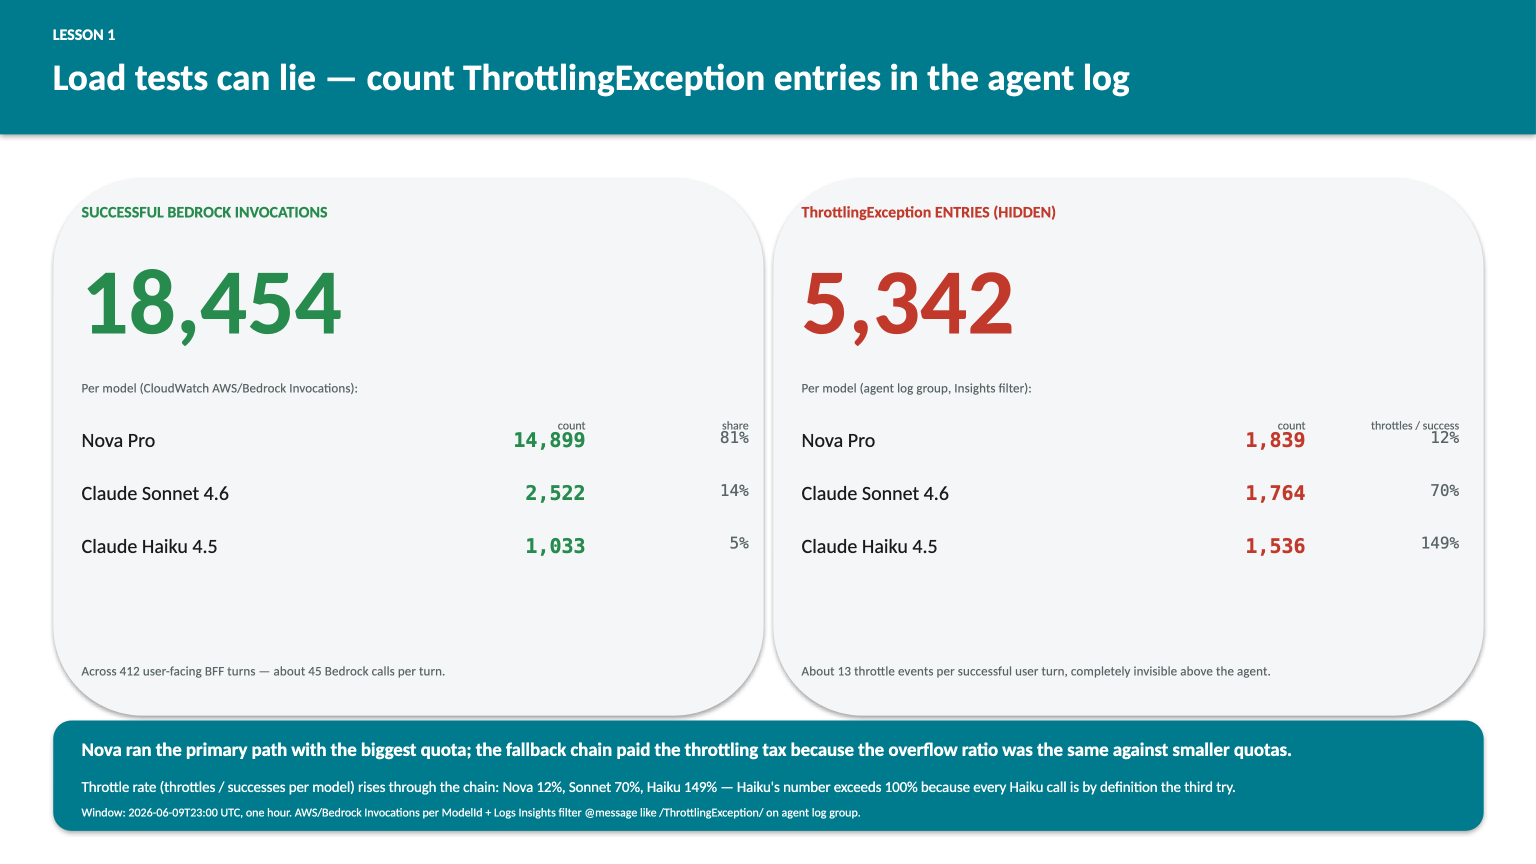
412 BFF turns succeeded in the load hour. Behind them, the agent fired 18,454 Bedrock model-level invocations (~45 per turn through the fallback chain) and absorbed 5,342 ThrottlingException events that the boto3 retry loop swallowed silently. Per model: Nova Pro 1,839 throttles against 14,899 successes (12% throttle rate); Sonnet 4.6 1,764 throttles against 2,522 successes (70%); Haiku 4.5 1,536 throttles against 1,033 successes (149% — more throttle events than successful calls, because every Haiku call is by definition the third try after Nova and Sonnet both failed). That asymmetry is the system working: Nova ran the primary path with the biggest quota; the fallback tiers paid the throttling tax on the overflow because their quotas were smaller and the overflow ratio was the same.
The mechanism is unglamorous. Bedrock at quota returns ThrottlingException. The AWS SDK retries with exponential backoff. Most agent SDKs (Strands included) add their own retry loop on top. Eventually the request gets through. The user sees a slightly slower response, the BFF logs a success, the Invocations count goes up by one — and the throttled attempts that preceded it are completely invisible unless you specifically count them in the agent’s logs.
That gap between “load test passed” and “load test passed cleanly” is dollars and latency and risk that nobody is looking at. I’m not sure how widely-known the failure mode is, but I’ve now seen it on two different production workloads this year, and neither team had a ThrottlingException counter on their dashboard before I asked them to add one.
The fix is one CloudWatch Logs Insights query against the agent’s log group — filter @message like /ThrottlingException/ | stats count() by model. The lesson is that “load test passed” without a throttle check is not the same statement.
Lesson 2 — Latency isn’t always model speed
The same workload had a separate problem. p95 of InvocationLatency was running at 45 seconds. The customer’s SLA said 30. The team had been quietly chasing this for weeks.
The natural assumption — the one I almost made too — was that the model was slow. There’s a recommended fix you can almost read in the room: swap to a smaller, faster model.
What changed my mind was splitting the latency into its two components. TimeToFirstToken has been a Bedrock metric since March 2026, and on this workload it told a story the latency metric alone could not:
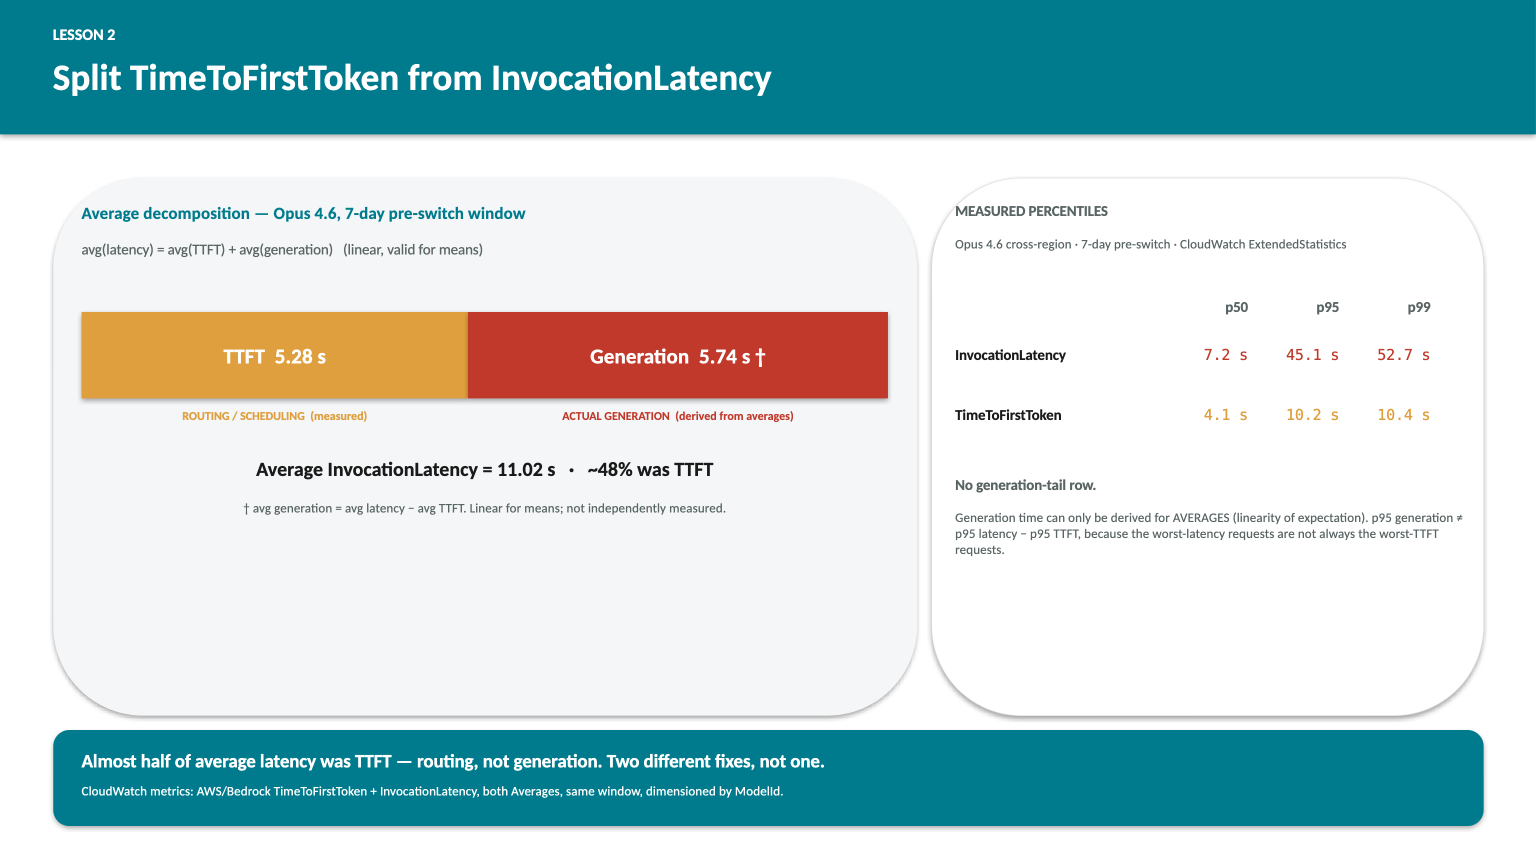
The averages decompose cleanly because expectation is linear: avg latency equals avg TTFT plus avg generation time, by construction. So if I have CloudWatch Averages for invocation latency and TTFT, I get the generation-time average for free as the difference. That’s a valid derivation for means, not for percentiles — p95 generation does not equal p95 latency minus p95 TTFT, because the percentiles can come from different requests. The side panel shows percentiles for the two metrics CloudWatch genuinely measures.
What the decomposition reveals: about 48% of average latency was time-to-first-token, not generation. Whatever the model was doing during those five seconds, it wasn’t generating any of the answer — routing, scheduling, the cross-region hop to the inference profile’s chosen region. The remaining 5.74s on average really was the model generating tokens on this workload, at this prompt size, at this output length.
Two different causes. Two different fixes. The “swap to a smaller model” reflex would have addressed the second one — and missed the first one entirely. Worse, if the team had ever moved to a model that was fast at generation but still cross-region, they would have shipped a fix and watched p95 not move enough, with no idea why.
The metric that makes this story tellable is TimeToFirstToken. It’s available, it’s a free CloudWatch query, and it should be on the same dashboard as InvocationLatency on every Bedrock workload. Most teams have one but not the other.
Lesson 3 — Prompt caching is almost never on
This is the one I want to write a whole separate post about, because the size of the wasted spend is bigger than most teams realise. For now, the short version.
Strands’ BedrockModel class exposes two parameters:
BedrockModel(
    model_id="eu.amazon.nova-pro-v1:0",
    cache_prompt="default",   # caches the system prompt
    cache_tools="default",    # caches the tool registry
)
Both default to None. Neither is set in the example code I’ve seen in the wild. The Strands tutorial doesn’t mention them. Neither does most of the agentic-AI content on Bedrock.
The metric that tells you it’s actually working post-deploy is cacheReadInputTokenCount. If it shows up after you ship, you’re hitting cache. If it doesn’t, you’re not, and your two-line change didn’t take effect.
There’s also a subtlety I had to find the hard way: cachePoint placement is gated per model, not just per feature. Amazon Nova accepts the cachePoint block in the system section but rejects it inside toolConfig.tools server-side with Malformed input request: extraneous key [cachePoint] is not permitted. Anthropic Sonnet / Haiku / Opus accept it in both. So the right pattern is one config-of-config: pass cache_prompt="default" to every model in your fallback chain, and pass cache_tools="default" only to the Anthropic-family models.
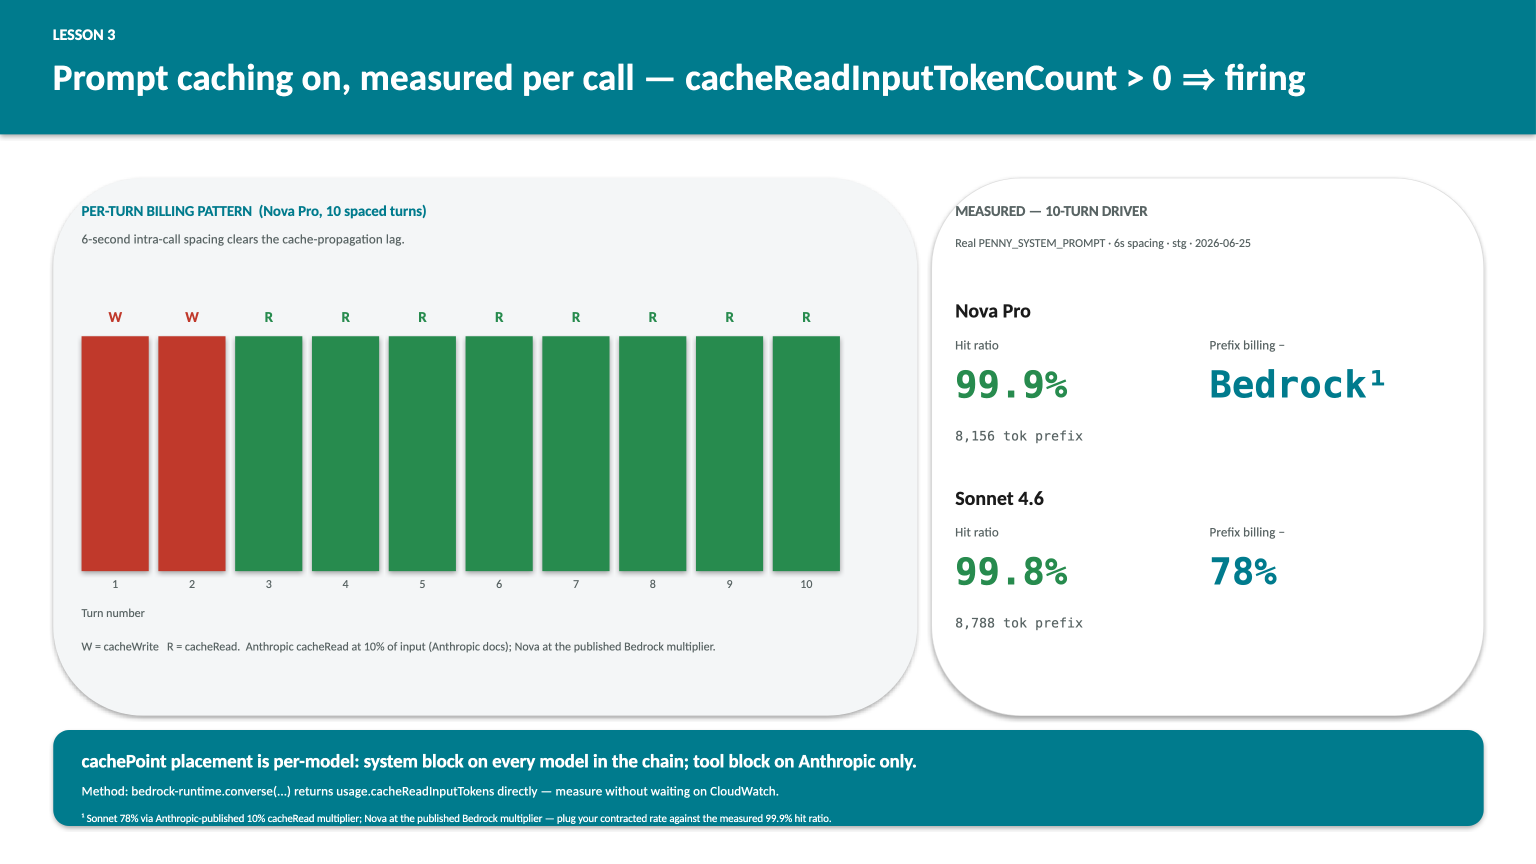
I measured this directly on the patched workload with a 10-turn driver, real system prompt, 6 seconds between calls (the 5-second cache-propagation lag is real — fire two calls inside a second and the second one will pay a fresh cache write instead of a read). The results:
| Model | Turns | Hit ratio | System-prefix billing reduction |
|---|---|---|---|
| Amazon Nova Pro | 10 | 99.9% | 55% |
| Anthropic Sonnet 4.6 | 10 | 99.8% | 78% |
The asymmetry is pricing-driven. Anthropic publishes its cache-read multiplier directly: 10% of input price per Anthropic docs (retrieved 2026-06-26), giving Sonnet 4.6 a 78% billing reduction on the system-prefix tokens at the measured 99.8% hit rate. Nova’s cache-read multiplier is on the AWS Bedrock pricing page; plug in your contracted rate against the measured 99.9% hit ratio to compute your own reduction. The percentage matters less than the direction: both are large and both are recoverable for the cost of two config kwargs and one boto3 SDK bump.
The per-call billing pattern is what makes this worth the two lines of config: on call 1 you pay a cache write at 125% of input price; on every subsequent call inside the 5-minute TTL you pay 10–25% of input price. If your agent’s call-amplification is high — every user turn in this workload fires ~4 Bedrock calls — the inside-TTL reads compound fast. If your agent is mostly one-shot, the math is less dramatic but still net-positive whenever any prefix gets reused.
What I now do first on any Bedrock workload
I have a short list — three CloudWatch queries — that I run before anything else. They’ve each surfaced something material on every Bedrock workload I’ve touched this year.
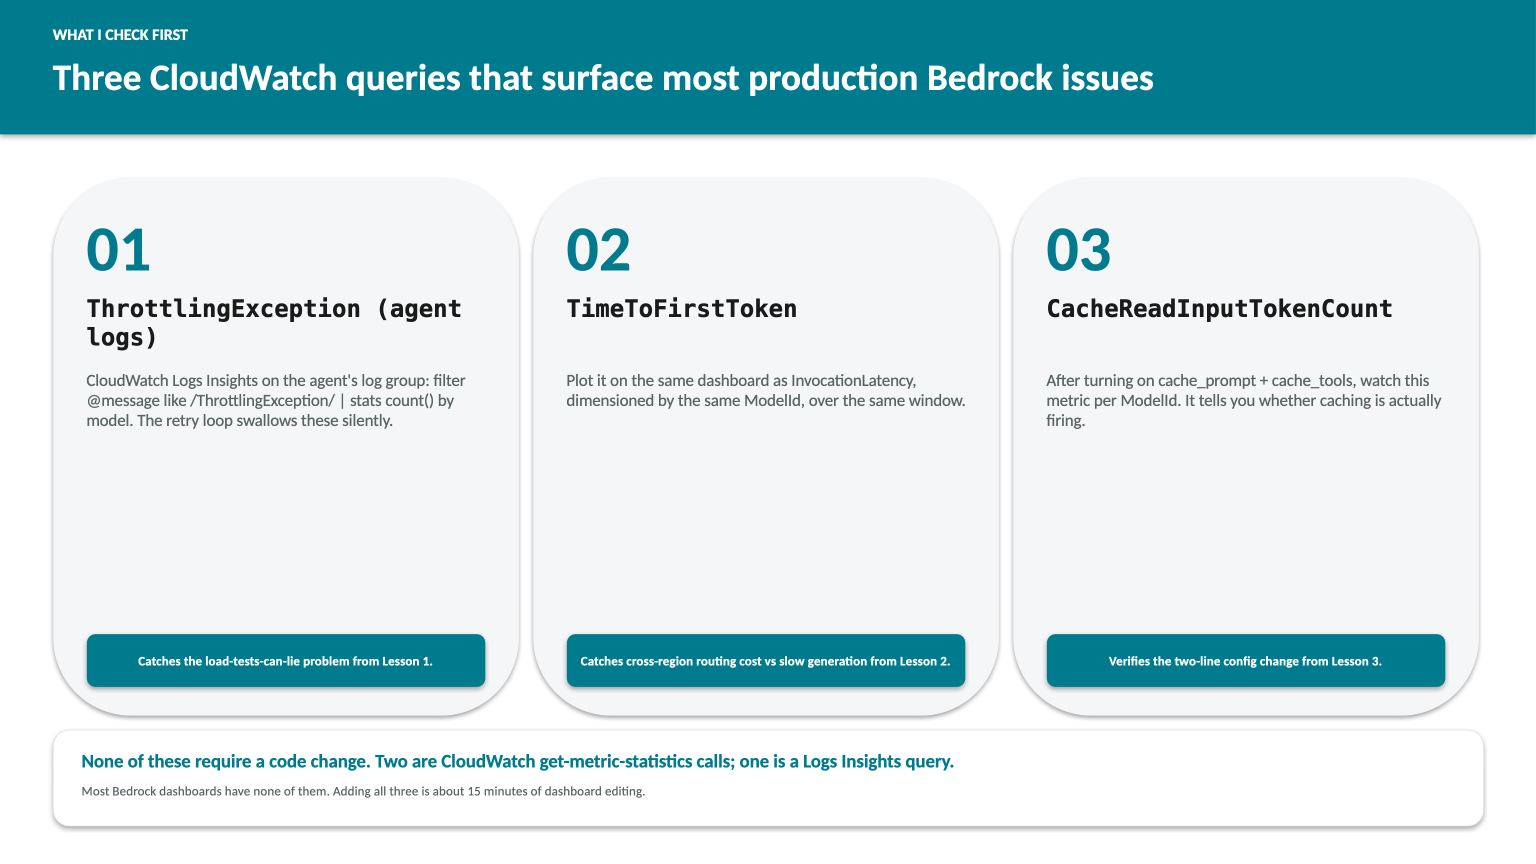
None of these requires any code change. They’re all standard CloudWatch get-metric-statistics calls, dimensioned by ModelId, against the AWS/Bedrock namespace. Most teams already have CloudWatch dashboards — they just don’t have these three metrics on them.
If you’re running a Strands or Bedrock workload and any of this sounds familiar, the three queries take about 15 minutes. The results either reassure you or surface something worth fixing. Either is useful.
Changes shipped on the workload
For anyone curious about what actually moved on the engagement that surfaced these — release-notes style, with the metric that verifies each one:
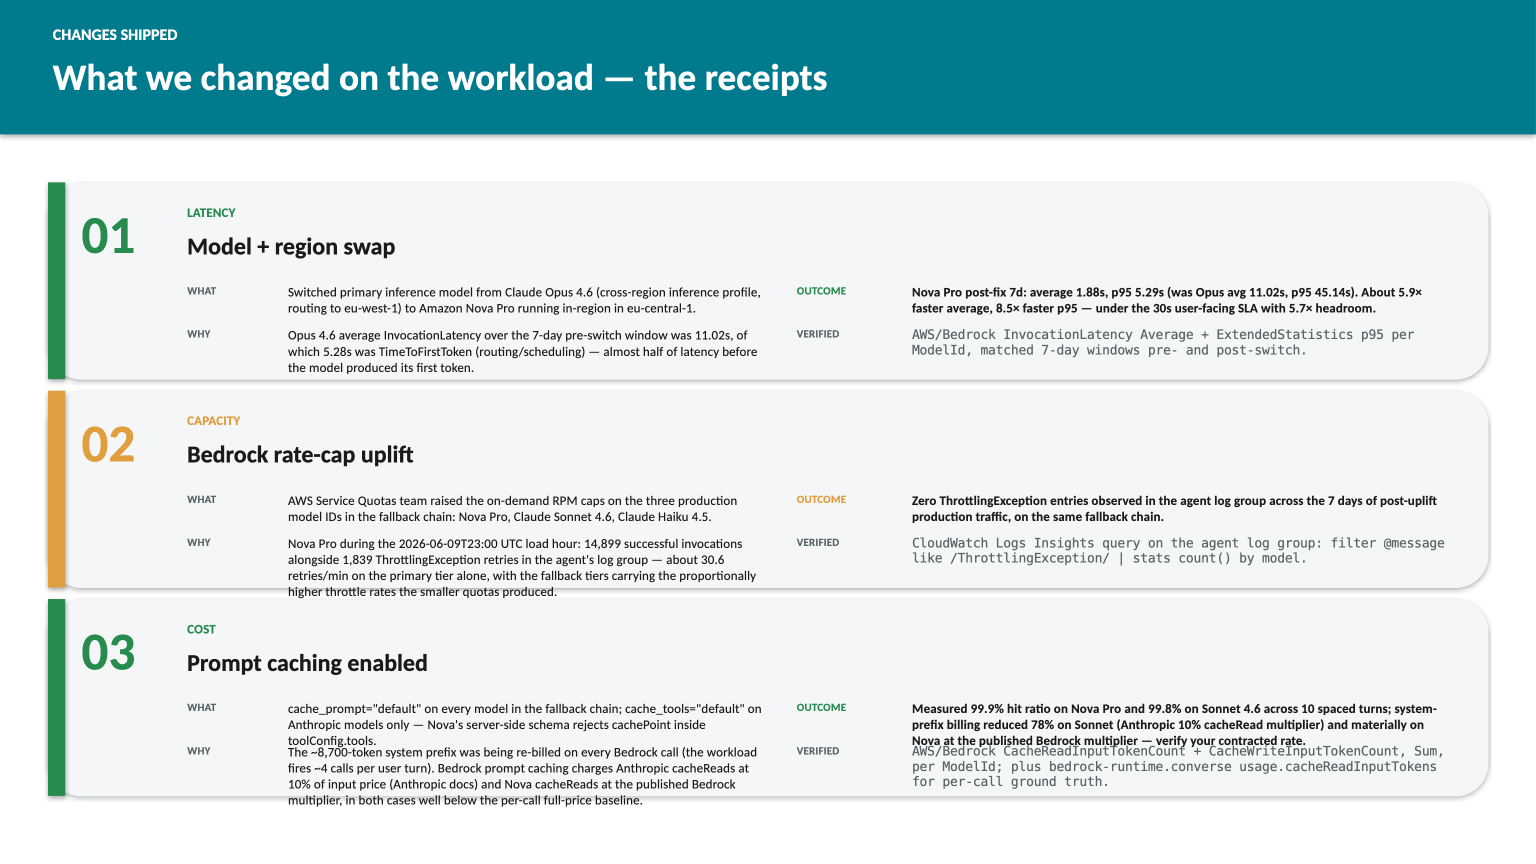
The latency improvement is real but mixed-attribution — the team switched both the model and the region simultaneously, so I can’t cleanly say how much was each. That’s a different post.
The Lesson 3 numbers are reproducible on demand. Methodology: real production system prompt (~8,700 tokens), 10-turn driver against the workload’s stg Bedrock account, 6-second intra-call spacing to clear the cache-propagation lag, both Nova Pro and Sonnet 4.6 in the same run. Anyone with a Bedrock-runtime client and a non-trivial system prompt can re-run the same shape against their own workload in five minutes; the per-call usage block returned by bedrock-runtime.converse(...) carries the cacheReadInputTokens and cacheWriteInputTokens fields directly, so the measurement doesn’t depend on waiting for CloudWatch to aggregate.
The bigger thread running through all three lessons: best practice gets you 80% of the way on any production AI workload. The other 20% — the part that costs real money or breaks at 3am — is where your workload’s specifics start to disagree with the default playbook. The way you find that 20% is by looking at the data. CloudWatch metrics, for your workload, this week, at your traffic.
The third metric in the title goes one layer deeper than that. The difference between a workload that accidentally works and one that’s verified to work is the measurement step — not just whether the dashboard exists, but whether anyone actually opens it after the deploy and pulls the numbers. Most teams skip that. Worth not skipping.
Series
This is part 1 of AI Operations Services — a series on the production-grade AWS AI work that doesn’t show up in demo videos. Performance, FinOps, observability, reliability, security. The work between “the agent technically works” and “the agent is something you’d trust your customer’s user behind.”
If you’re running production AI on AWS and want to compare notes — or get a second pair of eyes on a workload — happy to chat. Find me on LinkedIn or via rajmurugan.com.
Newsletter
Infrequent, high-signal posts on AWS + AI engineering — directly to your inbox.
Comments
- Loading comments…