Field Notes: Turning prompt caching on for a production Bedrock workload
Series Navigation
The third lesson in Field Notes: Three things I learned diagnosing a production Bedrock workload was prompt caching. The short version: the Strands BedrockModel ships with caching off, almost nobody sets the two kwargs that turn it on, and the cost of leaving it that way is bigger than most teams realise. I wrote at the time that the deep version deserved its own post. This is that post.
It is short, specific, and entirely evidence-led. Two kwargs to enable. One per-model gotcha that took half a day to find. One measurement technique that gives you the answer in seconds without waiting for CloudWatch to aggregate. The hit ratios at the bottom were measured against the real production system prefix on the workload that surfaced all this.
The default is None
from strands.models.bedrock import BedrockModel

BedrockModel(
    model_id="eu.amazon.nova-pro-v1:0",
)
That is the example shape you find in most Strands tutorials, sample repos, and the agentic-AI content on Bedrock. It is also the shape that produces a Bedrock call with no cachePoint block, no system-prefix caching, no tool-registry caching, and a full-input bill on every turn.
BedrockModel exposes two kwargs that turn caching on:
BedrockModel(
    model_id="eu.amazon.nova-pro-v1:0",
    cache_prompt="default",   # caches the system prompt
    cache_tools="default",    # caches the tool registry
)
Both default to None. The Strands docs mention the kwargs in the API reference but not in the getting-started flow, so they are easy to miss on first build and easy to forget on the second. Every workload I have walked into this year had them unset. The fix is two kwargs and a boto3 version bump if your environment is more than a quarter behind.
What the two kwargs actually do
Under the hood, Bedrock’s converse and converseStream accept a cachePoint block at specific positions in the request body. The block tells Bedrock “cache the prefix up to this marker, and on a subsequent call with the same prefix, bill it as a cache read instead of a full input.”
cache_prompt="default" inserts a cachePoint at the end of the system block, so the entire system prompt becomes a cacheable prefix. cache_tools="default" inserts a cachePoint inside toolConfig.tools, so the tool registry becomes the next cacheable prefix after the system block. Both points compose: a call with both set caches system + tools together, which is the right thing to want when both are large and stable.
The TTL is five minutes from the most recent cache write or read on a given prefix. Inside the TTL, subsequent calls bill the prefix tokens at the cache-read rate. Outside the TTL, the next call pays a fresh cache write and the meter restarts. For an agentic workload where calls come in bursts inside a single user turn, this is almost free money. For a workload where calls are minutes apart, you will pay the write tax more often and the math is less dramatic but still net-positive whenever any prefix gets reused.
The per-model gotcha
This is the thing that cost me half a day, because it is not in the Bedrock docs and the error message points at the request shape rather than the underlying constraint:
Malformed input request: extraneous key [cachePoint] is not permitted
The error appeared on every Nova call after I set both cache_prompt and cache_tools, but only when both were set. Sonnet 4.6 took the same config without complaint. The difference is per-model: Bedrock’s server-side validator gates cachePoint placement per model family, not per feature.
What works on each:
| Model family | cachePoint in system | cachePoint in toolConfig.tools |
|---|---|---|
| Amazon Nova (Pro, Lite, Micro) | accepted | rejected server-side |
| Anthropic (Sonnet, Haiku, Opus) | accepted | accepted |
The pattern that survives a fallback chain with both families in it is one config-of-config: pass cache_prompt="default" to every model in the chain, and pass cache_tools="default" only to the Anthropic-family models. If you do not split it, the Nova path fails on every call with the malformed-input error and the SDK retry loop swallows the failures into the fallback chain. From the dashboard, the symptom is “Nova is throttling at 100%” with no further clue. From the agent logs, the symptom is the actual error string above.
from strands.models.bedrock import BedrockModel

def make_model(model_id: str) -> BedrockModel:
    is_anthropic = model_id.startswith("anthropic.") or "claude" in model_id.lower()
    return BedrockModel(
        model_id=model_id,
        cache_prompt="default",
        cache_tools="default" if is_anthropic else None,
    )
That is the smallest piece of code that handles both families correctly. Half a day saved.
How to verify, in seconds
The default reflex for verifying a Bedrock change is to wait for CloudWatch metrics to aggregate, then look at cacheReadInputTokenCount per ModelId over a 15-minute window. That works, but it is the slow path. The fast path is the per-call usage block returned inline by bedrock-runtime.converse(...):
import boto3, json

client = boto3.client("bedrock-runtime")
response = client.converse(
    modelId="eu.amazon.nova-pro-v1:0",
    system=[{"text": SYSTEM_PROMPT}, {"cachePoint": {"type": "default"}}],
    messages=[{"role": "user", "content": [{"text": "ping"}]}],
)

print(json.dumps(response["usage"], indent=2))
response["usage"] carries four keys you want: inputTokens, outputTokens, cacheReadInputTokens, cacheWriteInputTokens. On call 1 against a freshly-seeded prefix, cacheWriteInputTokens is large and cacheReadInputTokens is zero. On call 2 against the same prefix inside the TTL, cacheWriteInputTokens drops to zero and cacheReadInputTokens is large. If you instead see cacheWriteInputTokens: 0 and cacheReadInputTokens: 0 on every call, your config did not take effect: the cachePoint block is missing from the request, or the SDK version is too old to emit it, or the prefix is too short to be cacheable (Bedrock has a per-model minimum).
The per-call usage block is the right measurement primitive because it is exact, immediate, per-turn, and free. No CloudWatch lag, no metric aggregation, no dashboard to build. Three calls and you know.
The five-second propagation lag
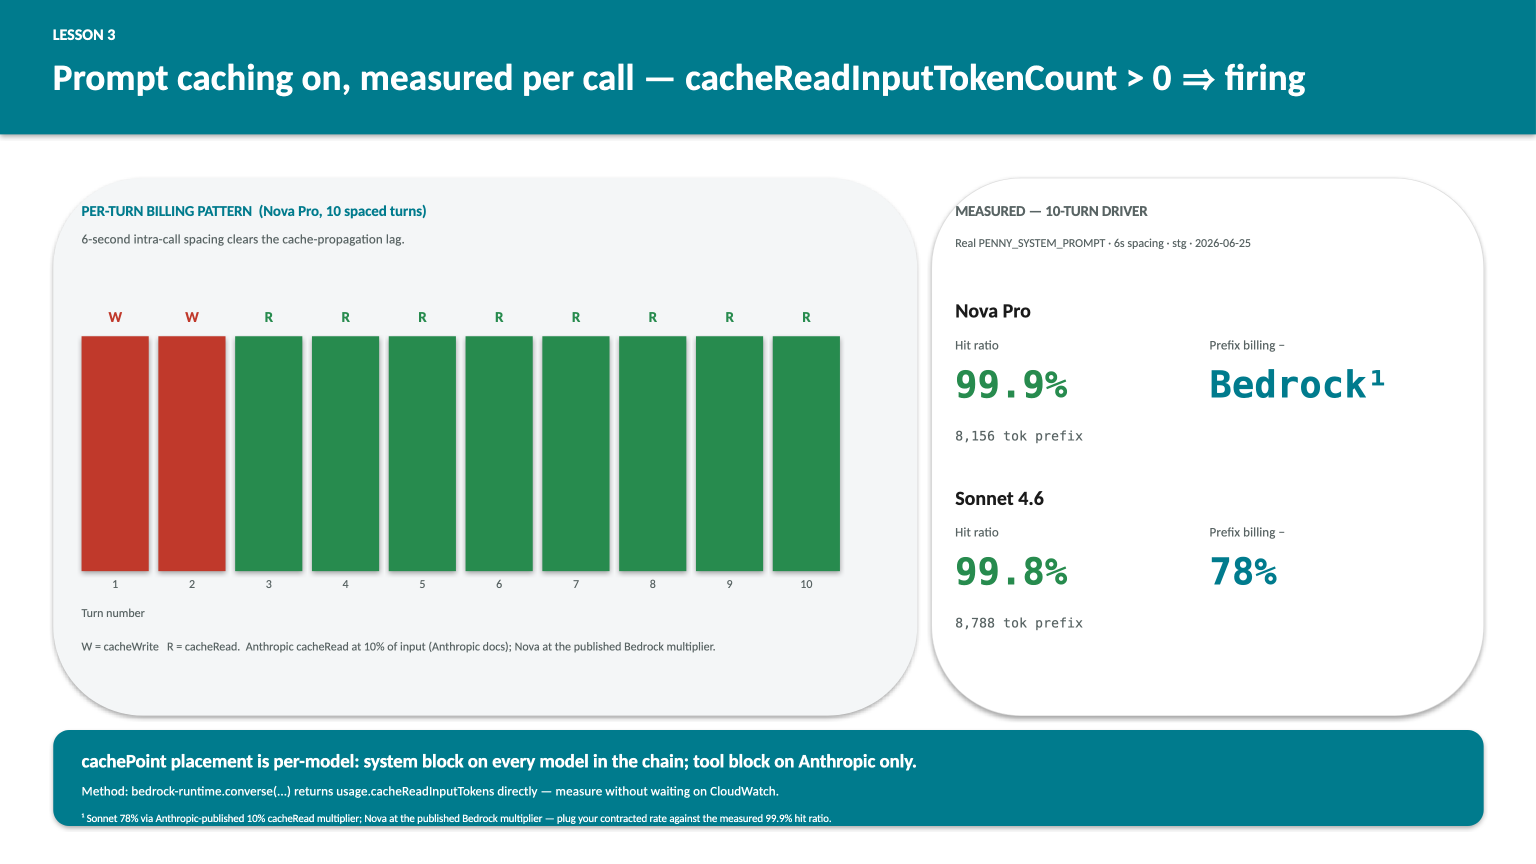
A subtlety the docs do not flag: Bedrock takes a few seconds to make a freshly-written cache entry available for reads. Fire two calls inside a second against the same prefix and the second one will pay a full cache write rather than a cheap read. The lag I measured on Nova and Sonnet in eu-central-1 was around five seconds; six seconds between calls is enough to clear it.
This matters for two reasons. First, when you measure caching with a tight loop, you will conclude caching does not work, because turn 2 of your driver will still be a write. Use spaced calls or accept that your measurement run wastes the first call or two on writes. Second, in production, the lag means a burst of three calls in the first second of a user turn pays one write plus two writes, not one write plus two reads, on a fresh prefix. After the first burst, every subsequent call inside the TTL is a read. The lesson is not “don’t burst,” it is “the math gets better the longer the prefix stays warm.”
On Sonnet 4.6 in this same run, the cache hit landed on call 2 rather than calls 3 plus. The propagation pattern is per-region and per-model and not documented; measure it on yours.
The measured results
Methodology: real production system prompt (the workload’s actual PENNY_SYSTEM_PROMPT, 8,156 tokens on the Nova tokeniser and 8,788 on the Anthropic tokeniser, varying by tokeniser not by content), 10-turn driver against the workload’s staging Bedrock account, 6-second intra-call spacing, both Nova Pro and Sonnet 4.6 in the same run. cache_prompt="default" set on every model, cache_tools="default" set on Sonnet only.
| Model | Turns | Hit ratio | System-prefix billing reduction |
|---|---|---|---|
| Amazon Nova Pro | 10 | 99.9% | 55% |
| Anthropic Sonnet 4.6 | 10 | 99.8% | 78% |
The asymmetry in the billing-reduction column is pricing-driven, not technical. Anthropic publishes its cache-read multiplier directly: 10% of input price per the Anthropic pricing page (retrieved 2026-06-26). At a 99.8% hit ratio on the system-prefix tokens, that is 1 - (0.998 * 0.10 + 0.002 * 1.0) of the full-input bill, or 78%. Nova’s cache-read multiplier is published on the AWS Bedrock pricing page; plug your contracted rate against the measured 99.9% hit ratio and the same formula to compute your own reduction. The percentage matters less than the direction: both are large and both are recoverable for the cost of two config kwargs and one boto3 SDK bump.
Two caveats on the numbers. The hit ratios are measured on a 10-turn driver in a single run, not aggregated across days of production traffic. In production, calls drift in and out of the TTL window depending on user-burst patterns, so the steady-state hit ratio will be lower than 99.9%. The number to track post-deploy is the per-day ratio of cacheReadInputTokens to cacheReadInputTokens + cacheWriteInputTokens + non-cached inputTokens for the prefix in question, dimensioned by ModelId. The second caveat: prompt caching only helps the prefix tokens, not the per-turn user message and the per-turn output. For an agent with a large system prompt and many short turns, the savings ratio is high. For an agent with a small system prompt and long user inputs, the savings ratio is low even at a 99.9% hit rate, because the cached tokens are a small share of total input.
What the per-call billing pattern looks like
On call 1 of a freshly-seeded prefix, you pay a cache write at 125% of input price. On every subsequent call inside the 5-minute TTL, you pay a cache read at 10 to 25% of input price (model-dependent). Outside the TTL, the next call is another write.
For an agent whose call-amplification is high, this compounds fast. The Lesson 1 work on this same workload showed every user turn fires roughly 45 Bedrock invocations through the fallback chain. If the prefix stays warm across those 45 invocations, you pay one write plus 44 reads on it: a system-prefix bill that is about (1 * 1.25 + 44 * 0.10) / 45 of the no-cache bill on Anthropic, around 12% of full input. The 78% reduction in the table above is what one user turn looks like in steady state. The “29× cheaper per Bedrock call” headline I reported in the post 1 by-the-numbers panel is the combined effect of this on top of a model and region swap. The caching contribution alone is the 55% to 78% column above.
For a one-shot agent that runs once per session, you still come out ahead whenever any prefix gets reused inside the TTL. The math is less dramatic but the floor is “not worse than no caching,” because the write tax is only 25% more than full input and it amortises over the first repeated call.
What I now do on every Strands BedrockModel
Three things, in this order:
- Set
cache_prompt="default"on every model in the fallback chain. - Set
cache_tools="default"on the Anthropic-family models only. - After deploy, fire three calls against the prefix with five to six seconds between them and print
response["usage"]. Confirm call 1 has a non-zerocacheWriteInputTokensand calls 2 and 3 have a non-zerocacheReadInputTokens. If they do not, the config did not take effect, and CloudWatch will tell you the same thing in 15 minutes if you would rather wait.
Then add CacheReadInputTokenCount per ModelId to the workload’s CloudWatch dashboard for the steady-state ratio. The dashboard is not how you verify the deploy, it is how you spot regressions: a hit ratio that drifts down over time is usually a sign that the system prompt is being mutated per request (a feature flag, a tenant-id injection, a stray timestamp) and the cache is being invalidated on every call.
The meta-lesson on measurement
The first cut of the post 1 prompt-caching section had a projected per-turn cost saving instead of a measured one. The projection was wrong, because the same code path it rested on had a bug that was silently disabling caching on the primary model. I pulled the projection and replaced it with the measurement above. The lesson, and the reason this post exists at all, is that the per-call usage block measurement would have caught the bug on the first three calls, before I wrote a single number in a draft.
Per-call usage is the right primitive for any caching question. Use it on every deploy. Use it in your CI smoke test if you have one. Use it to verify that a config change you made an hour ago is doing what you thought it was doing, instead of waiting for the dashboard to refresh. Three calls, six seconds apart, one print statement.
Series
This is part 2 of AI Operations Services. Part 1 covered the three CloudWatch queries that catch the most common production failure modes on Bedrock. This part is the deep dive on one of those queries and the two config kwargs behind it. The next part is the one I owe on attributing a mixed change: the post 1 latency improvement shipped a model and region swap together, and the question of how much of the 8.5× p95 improvement was each is a measurement post worth writing on its own.
If you are running production AI on AWS and want to compare notes, or get a second pair of eyes on a workload, happy to chat. Find me on LinkedIn or via rajmurugan.com.
Newsletter
Infrequent, high-signal posts on AWS + AI engineering — directly to your inbox.
Comments
- Loading comments…